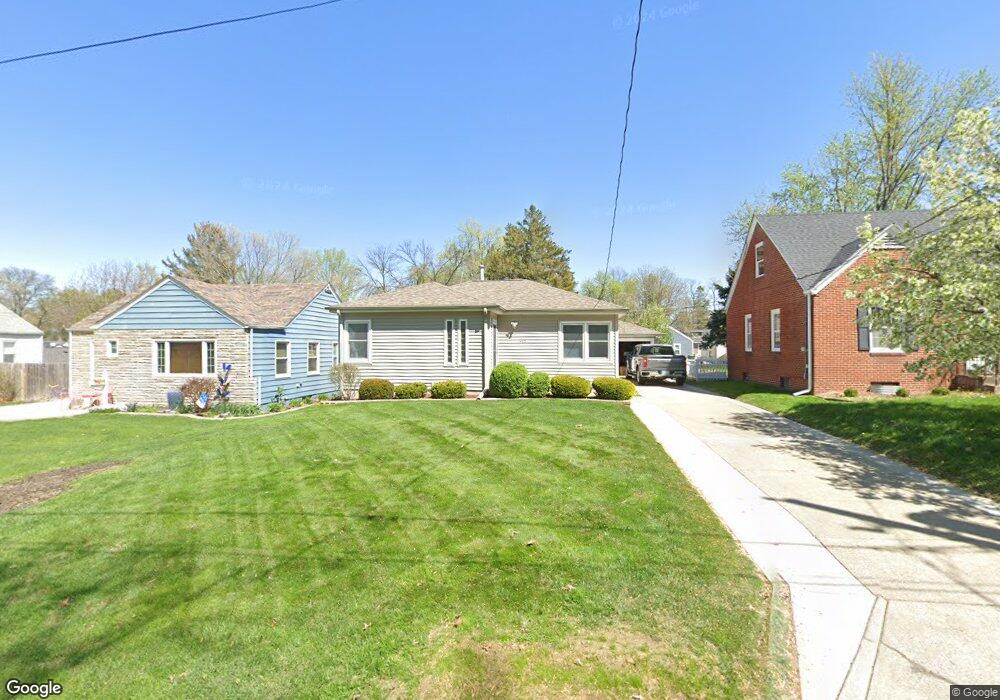
1447 57th St Des Moines, IA 50311
Merle Hay NeighborhoodEstimated Value: $229,000 - $262,000
2
Beds
2
Baths
1,079
Sq Ft
$223/Sq Ft
Est. Value
About This Home
This home is located at 1447 57th St, Des Moines, IA 50311 and is currently estimated at $240,592, approximately $222 per square foot. 1447 57th St is a home located in Polk County with nearby schools including Windsor Elementary School, Merrill Middle School, and Roosevelt High School.
Ownership History
Date
Name
Owned For
Owner Type
Purchase Details
Closed on
Nov 29, 2021
Sold by
Allen Gary and Allen Shirley
Bought by
Allen Jeffrey M
Current Estimated Value
Purchase Details
Closed on
Mar 19, 2019
Sold by
City Of Des Moines
Bought by
City Of Des Moines
Purchase Details
Closed on
Feb 28, 2010
Sold by
Fitzgerald Timothy M and Fitzgerald Monica Marie
Bought by
Allen Gary and Allen Shirley
Purchase Details
Closed on
Jun 20, 2001
Sold by
Frazier Derek and Frazier Clarice
Bought by
Tax 214
Create a Home Valuation Report for This Property
The Home Valuation Report is an in-depth analysis detailing your home's value as well as a comparison with similar homes in the area
Home Values in the Area
Average Home Value in this Area
Purchase History
| Date | Buyer | Sale Price | Title Company |
|---|---|---|---|
| Allen Jeffrey M | -- | None Available | |
| City Of Des Moines | -- | None Available | |
| Allen Gary | $127,500 | Itc | |
| Tax 214 | -- | -- |
Source: Public Records
Tax History Compared to Growth
Tax History
| Year | Tax Paid | Tax Assessment Tax Assessment Total Assessment is a certain percentage of the fair market value that is determined by local assessors to be the total taxable value of land and additions on the property. | Land | Improvement |
|---|---|---|---|---|
| 2025 | $3,728 | $212,200 | $40,700 | $171,500 |
| 2024 | $3,728 | $189,500 | $35,800 | $153,700 |
| 2023 | $3,882 | $189,500 | $35,800 | $153,700 |
| 2022 | $3,852 | $164,700 | $32,300 | $132,400 |
| 2021 | $3,678 | $164,700 | $32,300 | $132,400 |
| 2020 | $3,822 | $147,400 | $28,800 | $118,600 |
| 2019 | $3,502 | $147,400 | $28,800 | $118,600 |
| 2018 | $3,466 | $130,300 | $25,100 | $105,200 |
| 2017 | $3,138 | $130,300 | $25,100 | $105,200 |
| 2016 | $3,056 | $116,000 | $21,900 | $94,100 |
| 2015 | $3,056 | $116,000 | $21,900 | $94,100 |
| 2014 | $3,042 | $114,500 | $21,300 | $93,200 |
Source: Public Records
Map
Nearby Homes