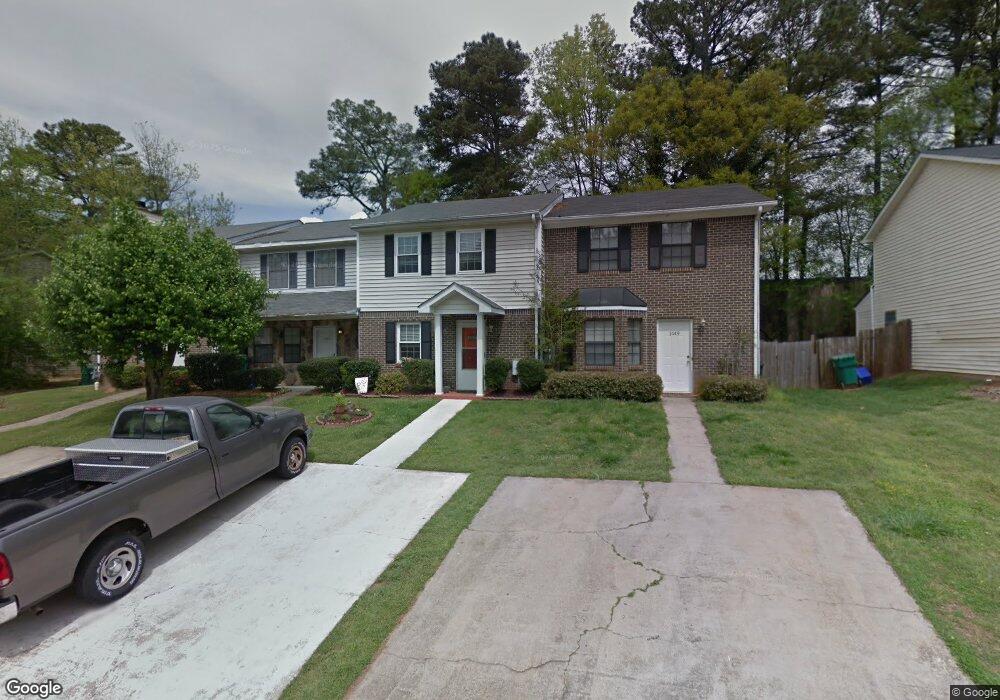
1447 Springleaf Cir SE Smyrna, GA 30080
Estimated Value: $249,000 - $262,000
2
Beds
3
Baths
1,120
Sq Ft
$229/Sq Ft
Est. Value
About This Home
This home is located at 1447 Springleaf Cir SE, Smyrna, GA 30080 and is currently estimated at $256,083, approximately $228 per square foot. 1447 Springleaf Cir SE is a home located in Cobb County with nearby schools including Smyrna Elementary School, Campbell Middle School, and Campbell High School.
Ownership History
Date
Name
Owned For
Owner Type
Purchase Details
Closed on
Oct 20, 2016
Sold by
Vazquez Sandra K
Bought by
Williams Lavonya J and Powell Vicki R
Current Estimated Value
Home Financials for this Owner
Home Financials are based on the most recent Mortgage that was taken out on this home.
Original Mortgage
$128,627
Outstanding Balance
$104,170
Interest Rate
3.87%
Mortgage Type
FHA
Estimated Equity
$151,913
Purchase Details
Closed on
Jun 22, 2005
Sold by
Bowie Melisa M
Bought by
Vazquez Sandra K
Home Financials for this Owner
Home Financials are based on the most recent Mortgage that was taken out on this home.
Original Mortgage
$97,735
Interest Rate
5.66%
Mortgage Type
VA
Purchase Details
Closed on
May 24, 1999
Sold by
Glasgow Ronald R
Bought by
Tyson Shawn T
Home Financials for this Owner
Home Financials are based on the most recent Mortgage that was taken out on this home.
Original Mortgage
$74,862
Interest Rate
7.23%
Mortgage Type
FHA
Create a Home Valuation Report for This Property
The Home Valuation Report is an in-depth analysis detailing your home's value as well as a comparison with similar homes in the area
Home Values in the Area
Average Home Value in this Area
Purchase History
| Date | Buyer | Sale Price | Title Company |
|---|---|---|---|
| Williams Lavonya J | $131,000 | -- | |
| Vazquez Sandra K | $99,300 | -- | |
| Tyson Shawn T | $74,900 | -- |
Source: Public Records
Mortgage History
| Date | Status | Borrower | Loan Amount |
|---|---|---|---|
| Open | Williams Lavonya J | $128,627 | |
| Previous Owner | Vazquez Sandra K | $97,735 | |
| Previous Owner | Tyson Shawn T | $74,862 |
Source: Public Records
Tax History Compared to Growth
Tax History
| Year | Tax Paid | Tax Assessment Tax Assessment Total Assessment is a certain percentage of the fair market value that is determined by local assessors to be the total taxable value of land and additions on the property. | Land | Improvement |
|---|---|---|---|---|
| 2025 | $2,447 | $103,300 | $34,000 | $69,300 |
| 2024 | $2,447 | $103,300 | $34,000 | $69,300 |
| 2023 | $2,526 | $93,020 | $34,000 | $59,020 |
Source: Public Records
Map
Nearby Homes
- 1537 Springleaf Cove SE
- 1768 Evenstad Way
- 3037 Ferrington Way
- 1700 Wynndowne Trail SE Unit C
- 2613 Davenport St SE
- 2582 Argo Dr SE
- 1761 Whitfield Parc Cir SE
- 2683 Davenport St SE
- 2909 Ferrington Way
- 1764 Whitfield Parc Cir
- 1704 Evenstad Way
- 2590 Bates St SE
- 2627 Argo Dr SE
- 3001 Hawthorne Place SE
- 2781 Mathews St SE
- 1799 Timber Valley Way SE
- 2791 Madison St SE
- 1579 Walker St SE
- 2807 Mathews St SE
- 2801 Priestcliff Dr SE
- 1447 Springleaf Cir SE Unit 1447
- 1445 Springleaf Cir SE
- 1449 Springleaf Cir SE
- 1443 Springleaf Cir SE
- 1443 Springleaf Cir SE
- 1451 Springleaf Cir SE Unit 2
- 1453 Springleaf Cir SE
- 1455 Springleaf Cir SE Unit II
- 1441 Springleaf Cir SE
- 1441 Springleaf Cir SE
- 1439 Springleaf Cir SE
- 1457 Springleaf Cir SE
- 1446 Springleaf Cir SE
- 1437 Springleaf Cir SE
- 1448 Springleaf Cir SE
- 1450 Springleaf Cir SE
- 1452 Springleaf Cir SE
- 1444 Springleaf Cir SE
- 1442 Springleaf Cir SE
- 1459 Springleaf Cir SE