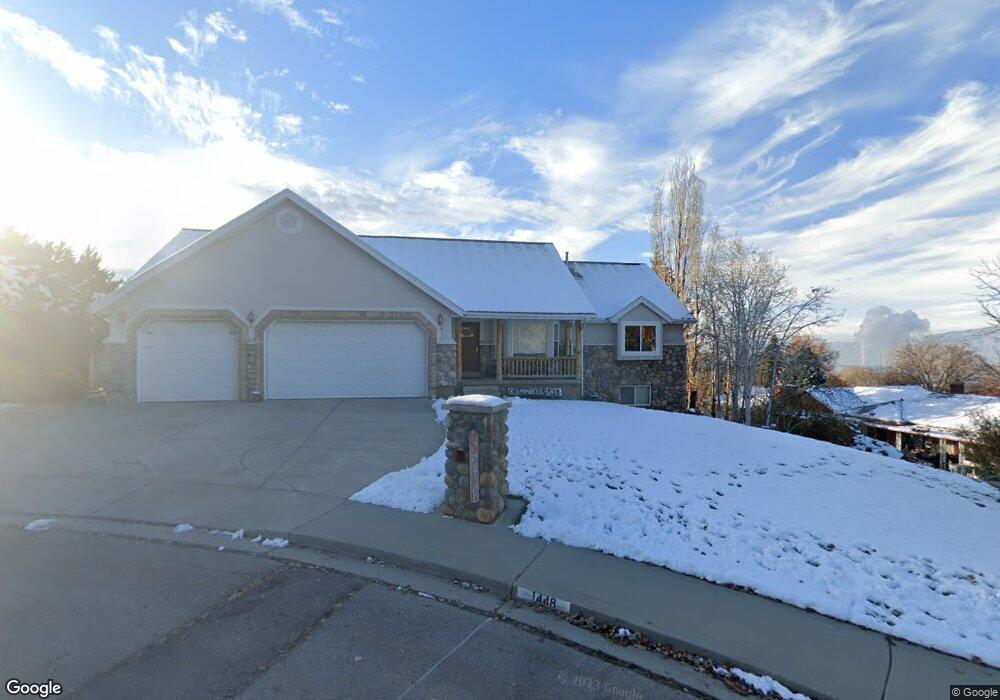
1448 E 50 S Pleasant Grove, UT 84062
Estimated Value: $742,966 - $800,000
5
Beds
4
Baths
3,676
Sq Ft
$208/Sq Ft
Est. Value
About This Home
This home is located at 1448 E 50 S, Pleasant Grove, UT 84062 and is currently estimated at $765,742, approximately $208 per square foot. 1448 E 50 S is a home located in Utah County with nearby schools including Grovecrest Elementary School, Pleasant Grove Junior High School, and Pleasant Grove High School.
Ownership History
Date
Name
Owned For
Owner Type
Purchase Details
Closed on
May 14, 2021
Sold by
Campbell Stuart M and Campbell Marbe K
Bought by
Campbell Marbe K and Campbell Stuart M
Current Estimated Value
Home Financials for this Owner
Home Financials are based on the most recent Mortgage that was taken out on this home.
Original Mortgage
$311,000
Outstanding Balance
$258,465
Interest Rate
3%
Mortgage Type
New Conventional
Estimated Equity
$507,277
Purchase Details
Closed on
Jul 31, 2008
Sold by
Spencer Ralph A and Spencer Cindy A
Bought by
Campbell Stuart M and Campbell Marbe K
Home Financials for this Owner
Home Financials are based on the most recent Mortgage that was taken out on this home.
Original Mortgage
$342,000
Interest Rate
6.32%
Mortgage Type
Purchase Money Mortgage
Create a Home Valuation Report for This Property
The Home Valuation Report is an in-depth analysis detailing your home's value as well as a comparison with similar homes in the area
Home Values in the Area
Average Home Value in this Area
Purchase History
| Date | Buyer | Sale Price | Title Company |
|---|---|---|---|
| Campbell Marbe K | -- | First American Title Ins Co | |
| Campbell Stuart M | -- | Equity Title Insurance Agen |
Source: Public Records
Mortgage History
| Date | Status | Borrower | Loan Amount |
|---|---|---|---|
| Open | Campbell Marbe K | $311,000 | |
| Closed | Campbell Stuart M | $342,000 |
Source: Public Records
Tax History Compared to Growth
Tax History
| Year | Tax Paid | Tax Assessment Tax Assessment Total Assessment is a certain percentage of the fair market value that is determined by local assessors to be the total taxable value of land and additions on the property. | Land | Improvement |
|---|---|---|---|---|
| 2025 | $2,928 | $372,735 | $243,000 | $434,700 |
| 2024 | $2,928 | $341,715 | $0 | $0 |
| 2023 | $2,783 | $340,010 | $0 | $0 |
| 2022 | $2,760 | $335,555 | $0 | $0 |
| 2021 | $2,385 | $441,500 | $174,300 | $267,200 |
| 2020 | $2,196 | $398,500 | $155,600 | $242,900 |
| 2019 | $1,995 | $374,400 | $143,000 | $231,400 |
| 2018 | $2,079 | $368,800 | $138,800 | $230,000 |
| 2017 | $2,025 | $191,290 | $0 | $0 |
| 2016 | $1,804 | $164,505 | $0 | $0 |
| 2015 | $1,753 | $151,360 | $0 | $0 |
| 2014 | $1,693 | $144,815 | $0 | $0 |
Source: Public Records
Map
Nearby Homes
- 10 S 1400 E
- 66 S 1185 E Unit 304
- 177 S 1150 E
- 26 S 1185 E
- Prelude Plan at Blossom Hill
- Treble Plan at Blossom Hill
- Browning Plan at Blossom Hill
- Cantata Plan at Blossom Hill
- 176 S 1150 E
- Accord Plan at Blossom Hill
- Canon Plan at Blossom Hill
- Trio Plan at Blossom Hill
- Harrison Plan at Blossom Hill
- Adagio Plan at Blossom Hill
- Tempo Plan at Blossom Hill
- Ballad Plan at Blossom Hill
- Timpani Plan at Blossom Hill
- Octave Plan at Blossom Hill
- Interlude Plan at Blossom Hill
- Crescendo Plan at Blossom Hill