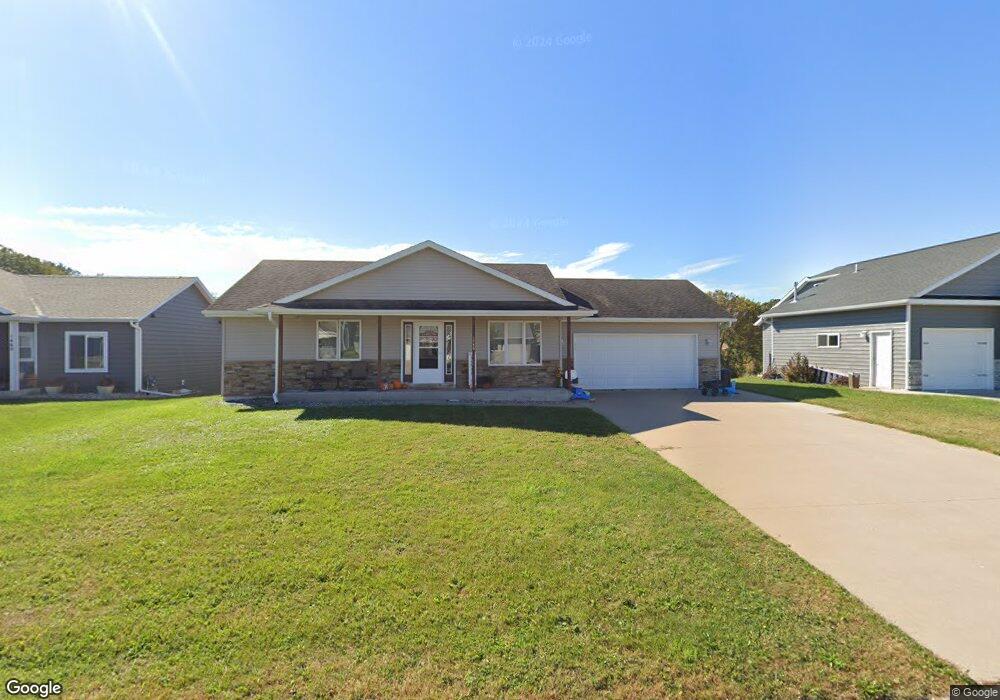
1448 Lone Stone Ct SE Chatfield, MN 55923
Estimated Value: $343,000 - $348,000
2
Beds
1
Bath
1,310
Sq Ft
$264/Sq Ft
Est. Value
About This Home
This home is located at 1448 Lone Stone Ct SE, Chatfield, MN 55923 and is currently estimated at $346,039, approximately $264 per square foot. 1448 Lone Stone Ct SE is a home located in Fillmore County with nearby schools including Chatfield Elementary School, Chatfield Secondary School, and St. Paul Lutheran School.
Ownership History
Date
Name
Owned For
Owner Type
Purchase Details
Closed on
Oct 21, 2021
Sold by
Tweten Chad G
Bought by
Kirby John and Kirby Alexandra
Current Estimated Value
Home Financials for this Owner
Home Financials are based on the most recent Mortgage that was taken out on this home.
Original Mortgage
$290,000
Outstanding Balance
$264,453
Interest Rate
2.8%
Mortgage Type
Purchase Money Mortgage
Estimated Equity
$81,586
Purchase Details
Closed on
Oct 25, 2005
Sold by
Lone Stone Llc
Bought by
Tweten Chad Gordon
Home Financials for this Owner
Home Financials are based on the most recent Mortgage that was taken out on this home.
Original Mortgage
$112,997
Interest Rate
6.04%
Mortgage Type
New Conventional
Create a Home Valuation Report for This Property
The Home Valuation Report is an in-depth analysis detailing your home's value as well as a comparison with similar homes in the area
Home Values in the Area
Average Home Value in this Area
Purchase History
| Date | Buyer | Sale Price | Title Company |
|---|---|---|---|
| Kirby John | $290,000 | None Available | |
| Tweten Chad Gordon | $131,000 | None Available |
Source: Public Records
Mortgage History
| Date | Status | Borrower | Loan Amount |
|---|---|---|---|
| Open | Kirby John | $290,000 | |
| Previous Owner | Tweten Chad Gordon | $112,997 |
Source: Public Records
Tax History Compared to Growth
Tax History
| Year | Tax Paid | Tax Assessment Tax Assessment Total Assessment is a certain percentage of the fair market value that is determined by local assessors to be the total taxable value of land and additions on the property. | Land | Improvement |
|---|---|---|---|---|
| 2025 | $4,296 | $310,700 | $45,000 | $265,700 |
| 2024 | $4,296 | $282,000 | $45,000 | $237,000 |
| 2023 | $3,876 | $282,000 | $45,000 | $237,000 |
| 2022 | $3,876 | $243,800 | $45,000 | $198,800 |
| 2021 | $3,876 | $221,700 | $39,300 | $182,400 |
| 2020 | $3,830 | $221,700 | $39,300 | $182,400 |
| 2019 | $3,228 | $182,900 | $39,300 | $143,600 |
| 2018 | $2,806 | $182,900 | $39,300 | $143,600 |
| 2017 | -- | $171,500 | $39,300 | $132,200 |
| 2016 | $2,504 | $171,500 | $39,300 | $132,200 |
| 2015 | $2,146 | $144,500 | $34,066 | $110,434 |
| 2014 | $2,146 | $133,200 | $33,470 | $99,730 |
| 2013 | $2,146 | $132,400 | $33,440 | $98,960 |
Source: Public Records
Map
Nearby Homes
- 1173 Lone Stone Ct SE
- 32337 Juniper Rd
- 32592 Juniper Rd
- 1534 Enterprise Dr
- 1622 Enterprise Dr
- 1484 Enterprise Dr
- 1444 Enterprise Dr
- 1406 Enterprise Dr
- 1427 AMcO Dr SE
- 11251 Wisdom Ln
- 1057 John and Mary Dr SE
- 1003 Grand St SE
- 824 Main St S
- 318 Hawley St SE
- 380 7th St SE
- 702 Twiford St SW
- 613 Winona St SE
- 135 6th St SW
- 202 Winona St SE
- 26 Millhouse Ln SW
- 1436 Lone Stone Ct SE
- 1460 Lone Stone Ct SE
- 1424 Lone Stone Ct SE
- 1472 Lone Stone Ct SE
- 1412 Lone Stone Ct SE
- 1439 Lone Stone Ct SE
- 1427 Lone Stone Ct SE
- 1451 Lone Stone Ct SE
- 1484 Lone Stone Ct SE
- 1415 Lone Stone Ct SE
- 1376 Lone Stone Ct SE
- 1403 Lone Stone Ct SE
- 1043 Lone Stone Ct SE
- 1055 Lone Stone Ct SE
- 1031 Lone Stone Ct SE
- 1375 Lone Stone Ct SE
- 1067 Lone Stone Ct SE
- 1375 Lone Stone Ct SE
- 1113 Lone Stone Ct SE
- 1352 Lone Stone Ct SE