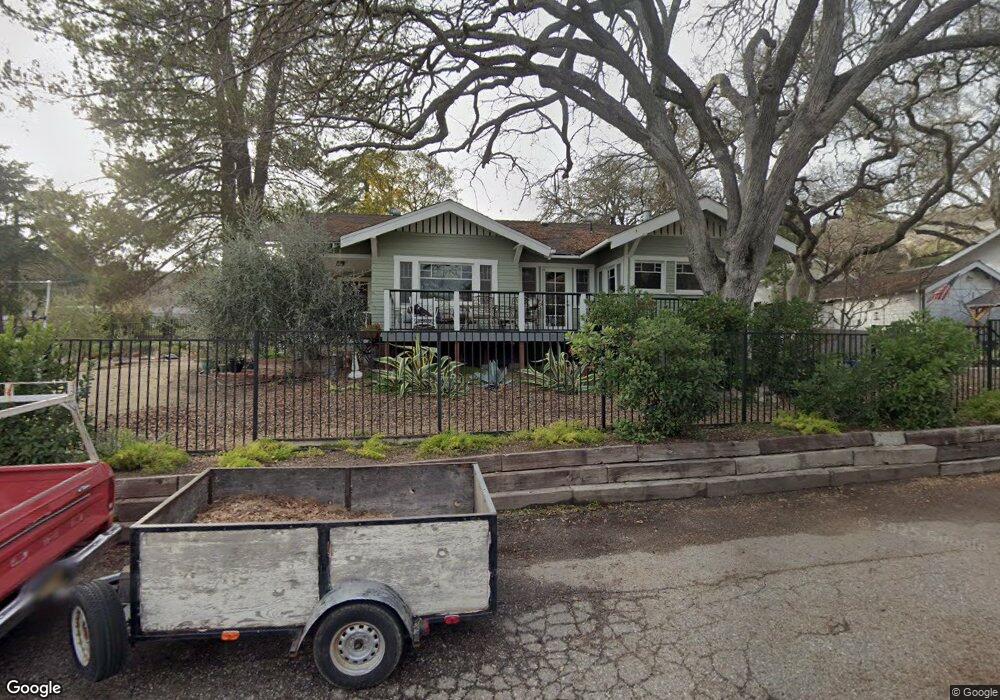
145 18th St Paso Robles, CA 93446
Estimated Value: $695,000 - $786,000
2
Beds
2
Baths
1,100
Sq Ft
$668/Sq Ft
Est. Value
About This Home
This home is located at 145 18th St, Paso Robles, CA 93446 and is currently estimated at $734,847, approximately $668 per square foot. 145 18th St is a home located in San Luis Obispo County with nearby schools including Glen Speck Elementary School, George H. Flamson Middle School, and Paso Robles High School.
Ownership History
Date
Name
Owned For
Owner Type
Purchase Details
Closed on
Apr 24, 2000
Sold by
Small Andru J and Small Kathleen S
Bought by
Bell Rodney E and Bell Anne D
Current Estimated Value
Home Financials for this Owner
Home Financials are based on the most recent Mortgage that was taken out on this home.
Original Mortgage
$175,000
Outstanding Balance
$59,739
Interest Rate
8.18%
Estimated Equity
$675,108
Purchase Details
Closed on
Sep 4, 1998
Sold by
Mckenzie Roger A
Bought by
Small Andru J and Small Kathleen S
Home Financials for this Owner
Home Financials are based on the most recent Mortgage that was taken out on this home.
Original Mortgage
$104,800
Interest Rate
6.89%
Create a Home Valuation Report for This Property
The Home Valuation Report is an in-depth analysis detailing your home's value as well as a comparison with similar homes in the area
Purchase History
| Date | Buyer | Sale Price | Title Company |
|---|---|---|---|
| Bell Rodney E | $169,000 | Fidelity National Title Co | |
| Small Andru J | $131,000 | Fidelity National Title Co |
Source: Public Records
Mortgage History
| Date | Status | Borrower | Loan Amount |
|---|---|---|---|
| Open | Bell Rodney E | $175,000 | |
| Previous Owner | Small Andru J | $104,800 | |
| Closed | Small Andru J | $13,100 |
Source: Public Records
Tax History
| Year | Tax Paid | Tax Assessment Tax Assessment Total Assessment is a certain percentage of the fair market value that is determined by local assessors to be the total taxable value of land and additions on the property. | Land | Improvement |
|---|---|---|---|---|
| 2025 | $2,831 | $259,721 | $115,258 | $144,463 |
| 2024 | $2,785 | $254,630 | $112,999 | $141,631 |
| 2023 | $2,785 | $249,638 | $110,784 | $138,854 |
| 2022 | $2,743 | $244,744 | $108,612 | $136,132 |
| 2021 | $2,696 | $239,946 | $106,483 | $133,463 |
| 2020 | $2,660 | $237,487 | $105,392 | $132,095 |
| 2019 | $2,622 | $232,831 | $103,326 | $129,505 |
| 2018 | $2,586 | $228,266 | $101,300 | $126,966 |
| 2017 | $2,432 | $223,791 | $99,314 | $124,477 |
| 2016 | $2,384 | $219,404 | $97,367 | $122,037 |
| 2015 | $2,375 | $216,109 | $95,905 | $120,204 |
| 2014 | $2,293 | $211,877 | $94,027 | $117,850 |
Source: Public Records
Map
Nearby Homes
Your Personal Tour Guide
Ask me questions while you tour the home.