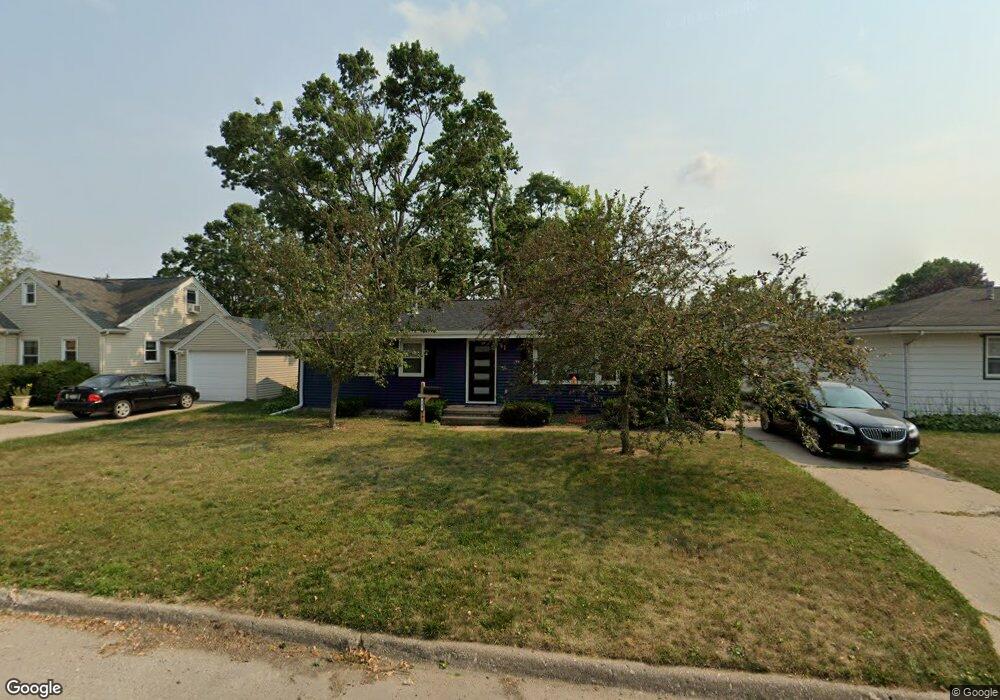
145 19th Ave SW Cedar Rapids, IA 52404
Southwest Area NeighborhoodEstimated Value: $168,000 - $176,000
3
Beds
1
Bath
1,013
Sq Ft
$172/Sq Ft
Est. Value
About This Home
This home is located at 145 19th Ave SW, Cedar Rapids, IA 52404 and is currently estimated at $173,860, approximately $171 per square foot. 145 19th Ave SW is a home located in Linn County with nearby schools including Junction City Elementary School, Grant Elementary School, and Bruce Hall Day Treatment Center.
Ownership History
Date
Name
Owned For
Owner Type
Purchase Details
Closed on
Apr 17, 2018
Sold by
Dressler Trevor P and Dressler Trevor Paul
Bought by
Krewson Cole James and Bahr Brandi N
Current Estimated Value
Home Financials for this Owner
Home Financials are based on the most recent Mortgage that was taken out on this home.
Original Mortgage
$117,776
Outstanding Balance
$101,191
Interest Rate
4.4%
Mortgage Type
FHA
Estimated Equity
$72,669
Purchase Details
Closed on
Sep 18, 2013
Sold by
Ollinger Tomye Lauren
Bought by
Dressler Trevor Paul
Purchase Details
Closed on
Jan 19, 2011
Sold by
Wyatt Kim Marie
Bought by
Dressler Trevor P and Ollinger Tomye
Home Financials for this Owner
Home Financials are based on the most recent Mortgage that was taken out on this home.
Original Mortgage
$99,000
Interest Rate
4.25%
Mortgage Type
Adjustable Rate Mortgage/ARM
Create a Home Valuation Report for This Property
The Home Valuation Report is an in-depth analysis detailing your home's value as well as a comparison with similar homes in the area
Home Values in the Area
Average Home Value in this Area
Purchase History
| Date | Buyer | Sale Price | Title Company |
|---|---|---|---|
| Krewson Cole James | $120,000 | None Available | |
| Dressler Trevor Paul | $2,500 | None Available | |
| Dressler Trevor P | $109,500 | None Available |
Source: Public Records
Mortgage History
| Date | Status | Borrower | Loan Amount |
|---|---|---|---|
| Open | Krewson Cole James | $117,776 | |
| Previous Owner | Dressler Trevor P | $99,000 |
Source: Public Records
Tax History Compared to Growth
Tax History
| Year | Tax Paid | Tax Assessment Tax Assessment Total Assessment is a certain percentage of the fair market value that is determined by local assessors to be the total taxable value of land and additions on the property. | Land | Improvement |
|---|---|---|---|---|
| 2025 | $2,386 | $169,500 | $40,100 | $129,400 |
| 2024 | $2,570 | $150,700 | $32,700 | $118,000 |
| 2023 | $2,570 | $145,300 | $29,700 | $115,600 |
| 2022 | $2,512 | $130,700 | $29,700 | $101,000 |
| 2021 | $2,516 | $130,200 | $29,700 | $100,500 |
| 2020 | $2,516 | $122,600 | $29,700 | $92,900 |
| 2019 | $2,196 | $110,400 | $25,300 | $85,100 |
| 2018 | $2,314 | $110,400 | $25,300 | $85,100 |
| 2017 | $2,314 | $109,300 | $25,300 | $84,000 |
| 2016 | $2,004 | $94,300 | $21,500 | $72,800 |
| 2015 | $1,990 | $93,538 | $21,478 | $72,060 |
| 2014 | $1,990 | $95,766 | $21,478 | $74,288 |
| 2013 | $1,994 | $95,766 | $21,478 | $74,288 |
Source: Public Records
Map
Nearby Homes
- 2021 Hamilton St SW
- 186 22nd Ave SW
- 1756 Mallory St SW
- 1804 I St SW
- 192 15th Ave SW
- 1411 1st St SW
- 2212 Deborah Dr SW
- 2321 Lauren Dr SW
- 69 26th Ave SW
- 2601 Teresa Dr SW
- 280 14th Ave SW
- 2818 Southland St SW
- 109 Evelyn Dr SW
- 1323 M St SW
- 90 29th Ave SW
- 1435 N St SW
- 329 12th Ave SE
- 2536 L St SW
- 1300 M St SW
- 1426 N St SW
- 147 19th Ave SW
- 141 19th Ave SW
- 1919 Cach Ln SW
- 139 19th Ave SW
- 1925 Cach Ln SW
- 137 19th Ave SW
- 1931 Cach Ln SW
- 1900 Cach Ln SW
- 1908 Cach Ln SW
- 142 20th Ave SW
- 142 20th Ave SW Unit E6
- 142 20th Ave SW Unit E5
- 142 20th Ave SW Unit E4
- 142 20th Ave SW Unit E3
- 142 20th Ave SW Unit E2
- 142 20th Ave SW Unit E1
- 142 20th Ave SW Unit W6
- 142 20th Ave SW Unit W5
- 142 20th Ave SW Unit W4
- 142 20th Ave SW Unit W3