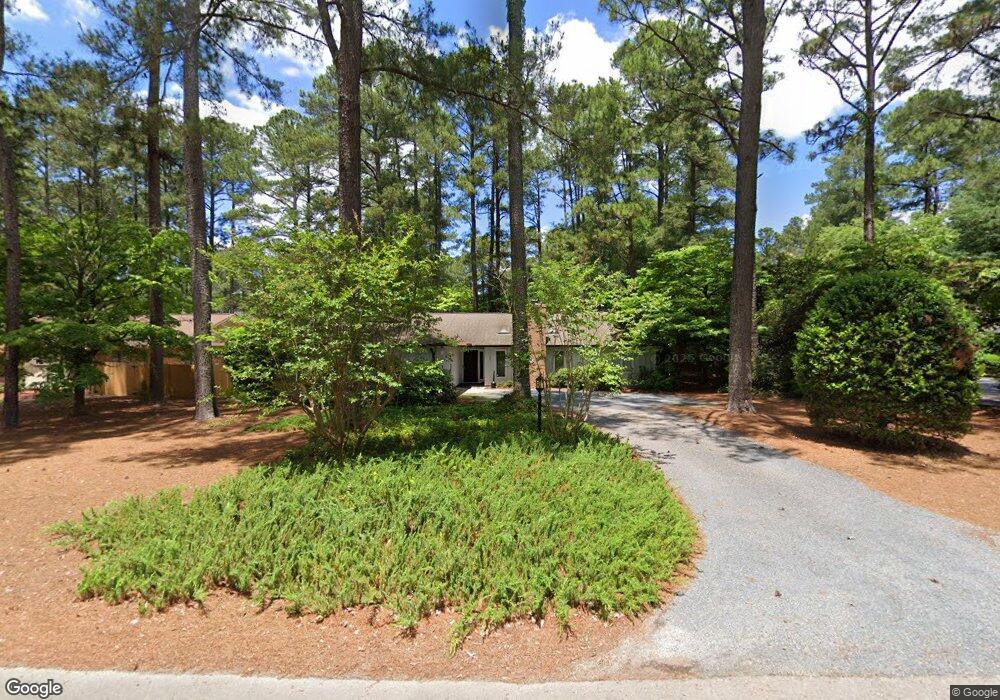
145 Burning Tree Rd Unit 1 Pinehurst, NC 28374
Estimated Value: $461,418 - $560,000
4
Beds
3
Baths
2,459
Sq Ft
$207/Sq Ft
Est. Value
About This Home
This home is located at 145 Burning Tree Rd Unit 1, Pinehurst, NC 28374 and is currently estimated at $509,105, approximately $207 per square foot. 145 Burning Tree Rd Unit 1 is a home located in Moore County with nearby schools including Pinehurst Elementary School, Southern Middle School, and Pinecrest High School.
Ownership History
Date
Name
Owned For
Owner Type
Purchase Details
Closed on
Jul 20, 2022
Sold by
Lupean Rommel Donna
Bought by
Lupean Mark
Current Estimated Value
Purchase Details
Closed on
Apr 2, 2008
Sold by
Gallagher Michael
Bought by
Rommel Donna Lupean
Home Financials for this Owner
Home Financials are based on the most recent Mortgage that was taken out on this home.
Original Mortgage
$166,420
Interest Rate
5.82%
Mortgage Type
Unknown
Purchase Details
Closed on
Nov 1, 2007
Sold by
St Clair Merryl and Martindale David J
Bought by
Lupean Mark and Gallagher Michael
Home Financials for this Owner
Home Financials are based on the most recent Mortgage that was taken out on this home.
Original Mortgage
$163,425
Interest Rate
6.27%
Mortgage Type
Unknown
Create a Home Valuation Report for This Property
The Home Valuation Report is an in-depth analysis detailing your home's value as well as a comparison with similar homes in the area
Home Values in the Area
Average Home Value in this Area
Purchase History
| Date | Buyer | Sale Price | Title Company |
|---|---|---|---|
| Lupean Mark | -- | Adams Donnell G | |
| Rommel Donna Lupean | -- | Adams | |
| Lupean Mark | $218,000 | None Available |
Source: Public Records
Mortgage History
| Date | Status | Borrower | Loan Amount |
|---|---|---|---|
| Previous Owner | Rommel Donna Lupean | $166,420 | |
| Previous Owner | Lupean Mark | $163,425 |
Source: Public Records
Tax History
| Year | Tax Paid | Tax Assessment Tax Assessment Total Assessment is a certain percentage of the fair market value that is determined by local assessors to be the total taxable value of land and additions on the property. | Land | Improvement |
|---|---|---|---|---|
| 2024 | $1,973 | $344,640 | $80,000 | $264,640 |
| 2023 | $2,059 | $344,640 | $80,000 | $264,640 |
| 2022 | $1,805 | $216,120 | $40,000 | $176,120 |
| 2021 | $1,869 | $216,120 | $40,000 | $176,120 |
| 2020 | $1,850 | $216,120 | $40,000 | $176,120 |
| 2019 | $1,850 | $216,120 | $40,000 | $176,120 |
| 2018 | $1,660 | $207,480 | $32,000 | $175,480 |
| 2017 | $1,639 | $207,480 | $32,000 | $175,480 |
| 2015 | $1,608 | $207,480 | $32,000 | $175,480 |
| 2014 | $1,454 | $190,090 | $35,000 | $155,090 |
| 2013 | -- | $190,090 | $35,000 | $155,090 |
Source: Public Records
Map
Nearby Homes
- 2 Westchester Place
- 200 Westchester Cir
- 305 Burning Tree Rd
- 80 Lake Forest Dr SW
- 100 Lakewood Dr
- 135 Lake Forest Dr SW
- 215 Merion Cir
- 250 Sugar Gum Ln Unit 207
- 250 Sugar Gum Ln Unit 201
- 250 Sugar Gum Ln Unit 226
- 1175 St Andrews Dr Unit 206
- 75 Hillcrest Rd
- 5 Quail Lake Rd W
- 90 Lake Shore Dr
- 375 Saint Andrews Dr
- 3 Merion Cir
- 280 Sugar Gum Ln Unit 168
- 75 Catalpa Ln N
- 2 Bob o Link Rd
- 70 Pitch Pine Ln Unit 10
- 125 Burning Tree Rd
- 165 Burning Tree Rd
- 4 Westchester Place
- 110 Westchester Cir
- 175 Burning Tree Rd
- 110 Burning Tree Rd
- 110 Burning Tree Rd Unit 1
- 160 Burning Tree Rd
- 1 Westchester Place
- 100 Westchester Cir
- 85 Burning Tree Rd
- 1 Westchester Place Unit 1
- 5 Firestone Ln
- 195 Burning Tree Rd Unit 1
- 25 Firestone Ln Unit 1
- 70 Cedar Wood Ct
- 180 Burning Tree Rd
- 115 Westchester Cir
- 120 Westchester Cir
- 65 Burning Tree Rd
Your Personal Tour Guide
Ask me questions while you tour the home.