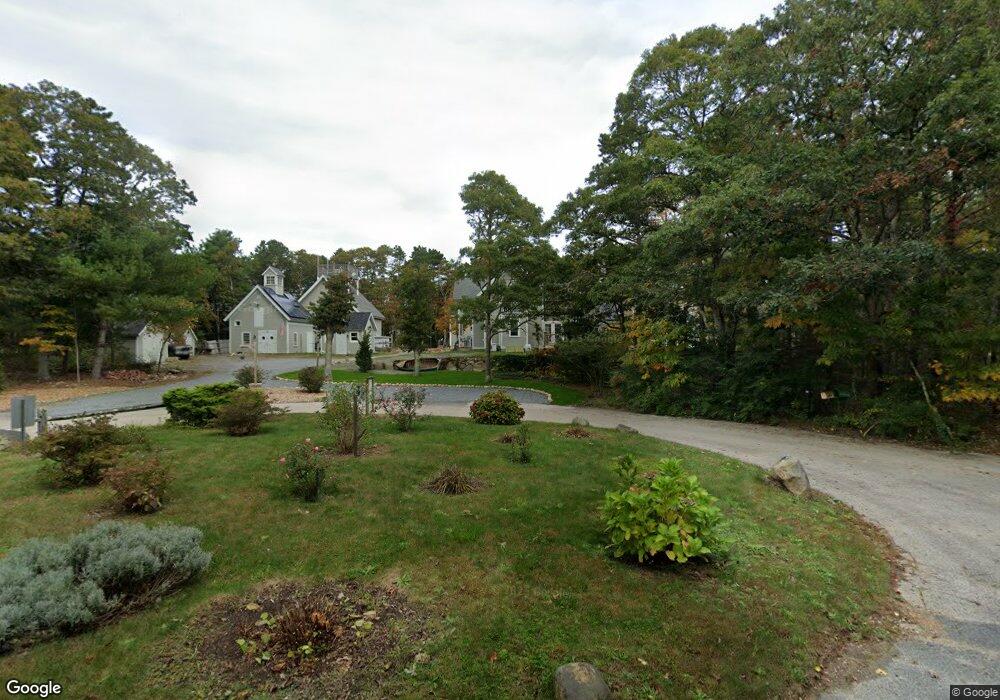
145 Deer Pond Rd East Falmouth, MA 02536
Hatchville NeighborhoodEstimated Value: $705,000 - $784,000
3
Beds
2
Baths
1,507
Sq Ft
$490/Sq Ft
Est. Value
About This Home
This home is located at 145 Deer Pond Rd, East Falmouth, MA 02536 and is currently estimated at $738,519, approximately $490 per square foot. 145 Deer Pond Rd is a home located in Barnstable County with nearby schools including Mullen-Hall School, Morse Pond School, and Lawrence School.
Ownership History
Date
Name
Owned For
Owner Type
Purchase Details
Closed on
Aug 16, 2011
Sold by
Hallinan Daniel E and Hallinan John P
Bought by
Hallinan Daniel E and Hallinan John P
Current Estimated Value
Purchase Details
Closed on
Sep 5, 2008
Sold by
Hallinan Daniel E and Hallinan John Patrick
Bought by
Hallinan Daniel E
Purchase Details
Closed on
Mar 1, 2007
Sold by
Hallinan Daniel E and Hallinan John Patrick
Bought by
Hallinan Daniel E and Hallinan John Patrick
Purchase Details
Closed on
Jul 23, 1993
Sold by
Fahnley Joel A and Fahnley Kim A
Bought by
Hallinan Daniel E
Home Financials for this Owner
Home Financials are based on the most recent Mortgage that was taken out on this home.
Original Mortgage
$158,450
Interest Rate
7.43%
Mortgage Type
Purchase Money Mortgage
Create a Home Valuation Report for This Property
The Home Valuation Report is an in-depth analysis detailing your home's value as well as a comparison with similar homes in the area
Home Values in the Area
Average Home Value in this Area
Purchase History
| Date | Buyer | Sale Price | Title Company |
|---|---|---|---|
| Hallinan Daniel E | -- | -- | |
| Hallinan Daniel E | -- | -- | |
| Hallinan Daniel E | -- | -- | |
| Hallinan Daniel E | $156,500 | -- |
Source: Public Records
Mortgage History
| Date | Status | Borrower | Loan Amount |
|---|---|---|---|
| Previous Owner | Hallinan Daniel E | $136,500 | |
| Previous Owner | Hallinan Daniel E | $158,450 | |
| Previous Owner | Hallinan Daniel E | $86,000 | |
| Previous Owner | Hallinan Daniel E | $84,000 |
Source: Public Records
Tax History Compared to Growth
Tax History
| Year | Tax Paid | Tax Assessment Tax Assessment Total Assessment is a certain percentage of the fair market value that is determined by local assessors to be the total taxable value of land and additions on the property. | Land | Improvement |
|---|---|---|---|---|
| 2025 | $4,188 | $713,500 | $200,800 | $512,700 |
| 2024 | $4,152 | $661,200 | $181,800 | $479,400 |
| 2023 | $4,065 | $587,400 | $181,800 | $405,600 |
| 2022 | $3,713 | $461,300 | $115,100 | $346,200 |
| 2021 | $3,637 | $427,900 | $110,100 | $317,800 |
| 2020 | $3,562 | $414,700 | $100,100 | $314,600 |
| 2019 | $3,266 | $381,500 | $100,100 | $281,400 |
| 2018 | $3,159 | $367,300 | $100,100 | $267,200 |
| 2017 | $3,048 | $357,300 | $100,100 | $257,200 |
| 2016 | $2,981 | $356,200 | $100,100 | $256,100 |
| 2015 | $2,917 | $356,200 | $100,100 | $256,100 |
| 2014 | $2,782 | $341,400 | $104,900 | $236,500 |
Source: Public Records
Map
Nearby Homes
- 12 Rock Hollow Dr
- 59 Whitecaps Dr
- 34 Mckenna Ridge Rd
- 12 Beach Plum Path
- 47 Shallow Pond Ln
- 61 Mckenna Ridge Dr
- 11 Shallow Pond Ln
- 68 Deepwood Dr
- 4 Josiah Path
- 7 Josiah Path
- 18 Josiah Path
- 20 Josiah Path
- 21 Josiah Path
- 30 Josiah Path
- 17 Pinewood Dr
- 590 Sandwich Rd
- 25 Harris Hill Rd
- 77 Highwood Ln
- 273 Sandwich Rd
- 26 Crooked Meadow Rd
- 30 Crooked Meadow Rd
- 142 Deer Pond Rd
- 175 Deer Pond Rd
- 36 Crooked Meadow Rd Unit 2A
- 36 Crooked Meadow Rd Unit 2B
- 36 Crooked Meadow Rd Unit B
- 36 Crooked Meadow Rd Unit 2A
- 36 Crooked Meadow Rd Unit 2B
- 36 Crooked Meadow Rd Unit B
- 36 Crooked Meadow Rd Unit 3A
- 36 Crooked Meadow Rd Unit 1A
- 36 Crooked Meadow Rd Unit 4B
- 36 Crooked Meadow Rd Unit 6A
- 36 Crooked Meadow Rd Unit 1B
- 36 Crooked Meadow Rd Unit 5B
- 36 Crooked Meadow Rd Unit 5A
- 36 Crooked Meadow Rd
- 10 Crooked Meadow Rd
- 40 Crooked Meadow Rd