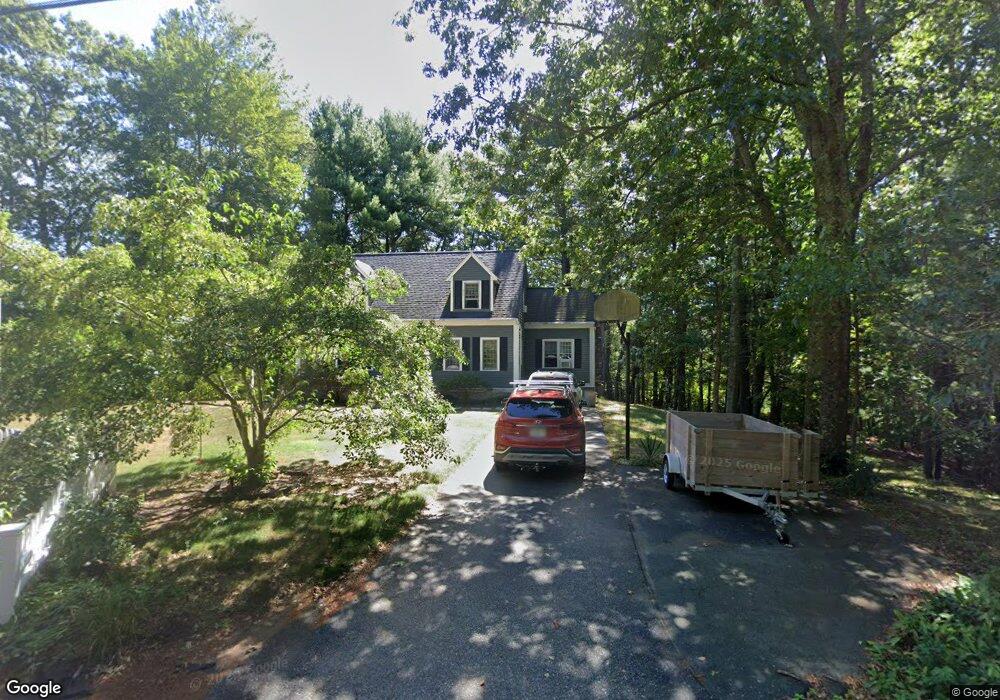
145 Elmer St Pembroke, MA 02359
Estimated Value: $566,000 - $711,000
--
Bed
2
Baths
1,613
Sq Ft
$386/Sq Ft
Est. Value
About This Home
This home is located at 145 Elmer St, Pembroke, MA 02359 and is currently estimated at $622,350, approximately $385 per square foot. 145 Elmer St is a home located in Plymouth County with nearby schools including Pembroke High School.
Ownership History
Date
Name
Owned For
Owner Type
Purchase Details
Closed on
Mar 22, 1991
Sold by
Alfonso Joseph F
Bought by
Wagner Kimberly A and Smith David F
Current Estimated Value
Home Financials for this Owner
Home Financials are based on the most recent Mortgage that was taken out on this home.
Original Mortgage
$110,700
Interest Rate
9.27%
Mortgage Type
Purchase Money Mortgage
Create a Home Valuation Report for This Property
The Home Valuation Report is an in-depth analysis detailing your home's value as well as a comparison with similar homes in the area
Home Values in the Area
Average Home Value in this Area
Purchase History
| Date | Buyer | Sale Price | Title Company |
|---|---|---|---|
| Wagner Kimberly A | $138,400 | -- |
Source: Public Records
Mortgage History
| Date | Status | Borrower | Loan Amount |
|---|---|---|---|
| Open | Wagner Kimberly A | $76,500 | |
| Closed | Wagner Kimberly A | $111,500 | |
| Closed | Wagner Kimberly A | $112,000 | |
| Closed | Wagner Kimberly A | $110,700 |
Source: Public Records
Tax History Compared to Growth
Tax History
| Year | Tax Paid | Tax Assessment Tax Assessment Total Assessment is a certain percentage of the fair market value that is determined by local assessors to be the total taxable value of land and additions on the property. | Land | Improvement |
|---|---|---|---|---|
| 2025 | $6,337 | $527,200 | $280,100 | $247,100 |
| 2024 | $6,271 | $521,300 | $275,300 | $246,000 |
| 2023 | $6,312 | $496,200 | $275,300 | $220,900 |
| 2022 | $5,967 | $421,700 | $225,300 | $196,400 |
| 2021 | $5,796 | $397,500 | $214,900 | $182,600 |
| 2020 | $5,632 | $388,700 | $205,300 | $183,400 |
| 2019 | $5,519 | $378,000 | $200,100 | $177,900 |
| 2018 | $5,310 | $356,600 | $185,300 | $171,300 |
| 2017 | $5,249 | $347,600 | $175,300 | $172,300 |
| 2016 | $5,137 | $336,600 | $165,300 | $171,300 |
| 2015 | $4,752 | $322,400 | $150,100 | $172,300 |
Source: Public Records
Map
Nearby Homes