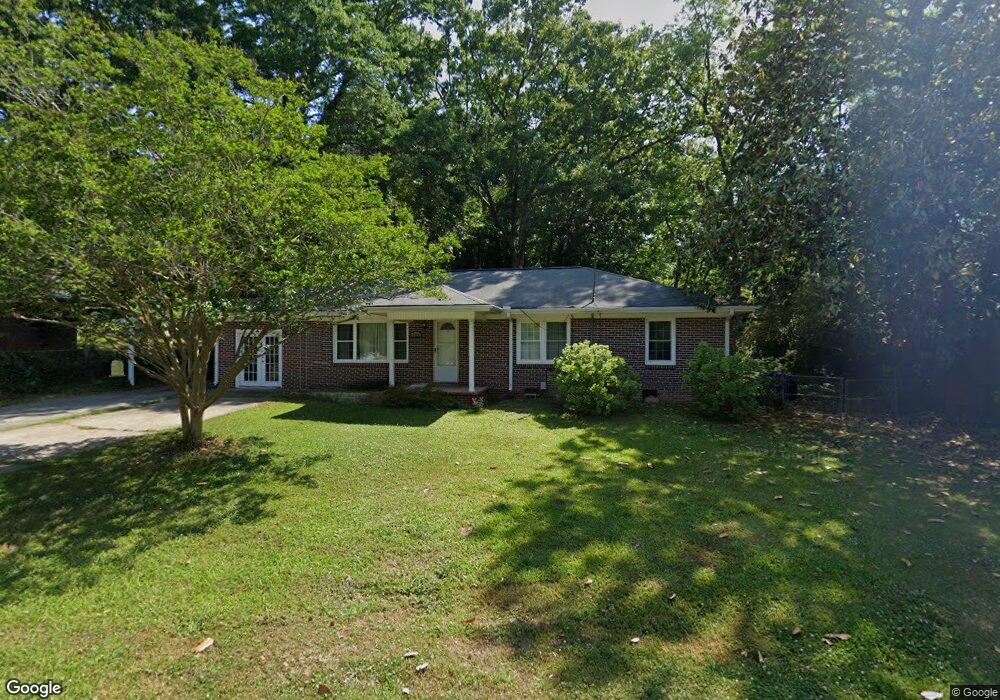
145 Hilltop Ln Toccoa, GA 30577
Estimated Value: $183,873 - $228,000
3
Beds
2
Baths
1,653
Sq Ft
$123/Sq Ft
Est. Value
About This Home
This home is located at 145 Hilltop Ln, Toccoa, GA 30577 and is currently estimated at $203,218, approximately $122 per square foot. 145 Hilltop Ln is a home located in Stephens County with nearby schools including Stephens County High School.
Ownership History
Date
Name
Owned For
Owner Type
Purchase Details
Closed on
Feb 13, 2024
Sold by
Goff Herman L
Bought by
Goff Herman and Goff Jennifer
Current Estimated Value
Home Financials for this Owner
Home Financials are based on the most recent Mortgage that was taken out on this home.
Original Mortgage
$105,000
Outstanding Balance
$102,243
Interest Rate
6.6%
Mortgage Type
New Conventional
Estimated Equity
$100,975
Purchase Details
Closed on
Jul 5, 2006
Sold by
Durham John R
Bought by
Goff Herman L and Goff Stacey E
Home Financials for this Owner
Home Financials are based on the most recent Mortgage that was taken out on this home.
Original Mortgage
$95,150
Interest Rate
8.91%
Mortgage Type
New Conventional
Purchase Details
Closed on
Jan 10, 2006
Sold by
Durham Karen C
Bought by
Durham John R
Purchase Details
Closed on
Jan 1, 1994
Bought by
<Buyer Info Not Present>
Create a Home Valuation Report for This Property
The Home Valuation Report is an in-depth analysis detailing your home's value as well as a comparison with similar homes in the area
Home Values in the Area
Average Home Value in this Area
Purchase History
| Date | Buyer | Sale Price | Title Company |
|---|---|---|---|
| Goff Herman | -- | -- | |
| Goff Herman L | $95,150 | -- | |
| Durham John R | -- | -- | |
| <Buyer Info Not Present> | $49,300 | -- |
Source: Public Records
Mortgage History
| Date | Status | Borrower | Loan Amount |
|---|---|---|---|
| Open | Goff Herman | $105,000 | |
| Previous Owner | Goff Herman L | $95,150 |
Source: Public Records
Tax History Compared to Growth
Tax History
| Year | Tax Paid | Tax Assessment Tax Assessment Total Assessment is a certain percentage of the fair market value that is determined by local assessors to be the total taxable value of land and additions on the property. | Land | Improvement |
|---|---|---|---|---|
| 2024 | $1,188 | $35,037 | $2,082 | $32,955 |
| 2023 | $1,086 | $32,399 | $2,082 | $30,317 |
| 2022 | $850 | $30,565 | $2,082 | $28,483 |
| 2021 | $815 | $28,049 | $2,082 | $25,967 |
| 2020 | $818 | $27,906 | $2,082 | $25,824 |
| 2019 | $821 | $27,906 | $2,082 | $25,824 |
| 2018 | $821 | $27,906 | $2,082 | $25,824 |
| 2017 | $834 | $27,906 | $2,082 | $25,824 |
| 2016 | $821 | $27,905 | $2,081 | $25,823 |
| 2015 | $841 | $27,311 | $2,081 | $25,230 |
| 2014 | $855 | $27,312 | $2,082 | $25,230 |
| 2013 | -- | $27,824 | $2,081 | $25,742 |
Source: Public Records
Map
Nearby Homes
- 229 Hilltop Ln
- 253 Stancil Dr
- 278 Stancil Dr
- 226 Poplar St
- 294 Stancil Dr
- 59 Sunset Ln
- 0 Valley Dr Unit 7675761
- 0 Valley Dr Unit 10600268
- 739 Poplar St
- 30 Moore Ave
- 128 Branch St
- 0 Hwy 17 Alt Unit 10577119
- 372 Hilltop Way
- 614 616 S Pond St
- 249 S Hill St
- 943 S Pond St
- 45 Hayes St
- 490 Addington Dr
- 178 Mitchell St
- 475 Hilltop Way
- 165 Hilltop Ln
- 0 Hilltop Ln Unit 8983505
- 0 Hilltop Ln Unit 9010940
- 0 Hilltop Ln Unit 9076155
- 0 Hilltop Ln Unit 8827580
- 0 Hilltop Ln Unit 3092183
- 0 Hilltop Ln Unit 3187719
- 0 Hilltop Ln Unit 7066737
- 0 Hilltop Ln Unit 7106359
- 0 Hilltop Ln Unit 7202712
- 0 Hilltop Ln Unit 7269400
- 0 Hilltop Ln Unit 7399193
- 0 Hilltop Ln Unit 8141075
- 0 Hilltop Ln Unit 8203138
- 0 Hilltop Ln Unit 8233258
- 0 Hilltop Ln Unit 8543510
- 0 Hilltop Ln Unit 8598857
- 123 Hilltop Ln
- 142 Hilltop Ln
- 162 Hilltop Ln