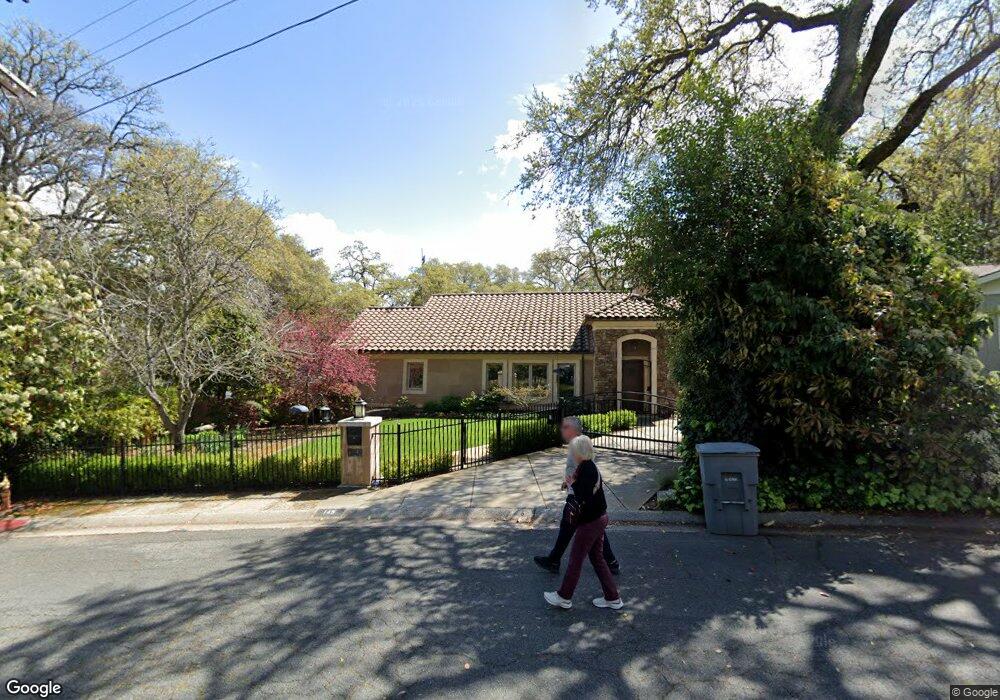
145 Midway Ave Auburn, CA 95603
Estimated Value: $676,000 - $951,000
3
Beds
3
Baths
3,348
Sq Ft
$253/Sq Ft
Est. Value
About This Home
This home is located at 145 Midway Ave, Auburn, CA 95603 and is currently estimated at $848,545, approximately $253 per square foot. 145 Midway Ave is a home located in Placer County with nearby schools including Skyridge Elementary School, Placer High School, and Alta Vista Community Charter.
Ownership History
Date
Name
Owned For
Owner Type
Purchase Details
Closed on
Jul 26, 2006
Sold by
Calac Gregory A and Calac Laurie P
Bought by
Calac Gregory A and Calac Laurie P
Current Estimated Value
Purchase Details
Closed on
Mar 31, 2006
Sold by
Joye William M and Joye Mary Ann
Bought by
Calac Gregory A and Calac Laurie P
Home Financials for this Owner
Home Financials are based on the most recent Mortgage that was taken out on this home.
Original Mortgage
$352,000
Outstanding Balance
$200,995
Interest Rate
6.25%
Mortgage Type
Fannie Mae Freddie Mac
Estimated Equity
$647,550
Purchase Details
Closed on
Jun 24, 2005
Sold by
Joye Martin J and Joye Micki
Bought by
Joye William M
Purchase Details
Closed on
Mar 20, 1998
Sold by
Joye William M
Bought by
Joye Nina R
Purchase Details
Closed on
Jun 29, 1995
Sold by
Joye William M
Bought by
Joye William M
Create a Home Valuation Report for This Property
The Home Valuation Report is an in-depth analysis detailing your home's value as well as a comparison with similar homes in the area
Home Values in the Area
Average Home Value in this Area
Purchase History
| Date | Buyer | Sale Price | Title Company |
|---|---|---|---|
| Calac Gregory A | -- | None Available | |
| Calac Gregory A | $440,000 | Placer Title Company | |
| Joye William M | -- | -- | |
| Joye Nina R | $83,590 | -- | |
| Joye William M | -- | -- | |
| Joye William M | -- | -- | |
| Joye William M | -- | -- |
Source: Public Records
Mortgage History
| Date | Status | Borrower | Loan Amount |
|---|---|---|---|
| Open | Calac Gregory A | $352,000 |
Source: Public Records
Tax History Compared to Growth
Tax History
| Year | Tax Paid | Tax Assessment Tax Assessment Total Assessment is a certain percentage of the fair market value that is determined by local assessors to be the total taxable value of land and additions on the property. | Land | Improvement |
|---|---|---|---|---|
| 2025 | $7,083 | $601,278 | $245,975 | $355,303 |
| 2023 | $7,083 | $577,931 | $236,424 | $341,507 |
| 2022 | $6,986 | $566,600 | $231,789 | $334,811 |
| 2021 | $6,769 | $555,492 | $227,245 | $328,247 |
| 2020 | $6,727 | $549,797 | $224,915 | $324,882 |
| 2019 | $6,619 | $539,017 | $220,505 | $318,512 |
| 2018 | $6,310 | $528,449 | $216,182 | $312,267 |
| 2017 | $6,176 | $518,089 | $211,944 | $306,145 |
| 2016 | $6,029 | $507,932 | $207,789 | $300,143 |
| 2015 | $5,870 | $500,303 | $204,668 | $295,635 |
| 2014 | $3,481 | $267,000 | $109,200 | $157,800 |
Source: Public Records
Map
Nearby Homes
- 1560 High St
- 465 Miles Ct
- 420 Miles Ct
- 1335 High St
- 135 Brewery Ln
- 11203 Welty Ln
- 192 College Way
- 303 Stone House Rd
- 201 Poet Smith Dr
- 156 Circle Dr
- 10899 Ophir Rd
- 235 Ginger Dr
- 399 Riverview Dr
- Residence 5 Plan at Canyon Creek
- Residence 3 Plan at Canyon Creek
- Residence 2 Plan at Canyon Creek
- Residence 1 Plan at Canyon Creek
- Residence 4 Plan at Canyon Creek
- 146 E Placer St
- 410 Canyon Creek Dr