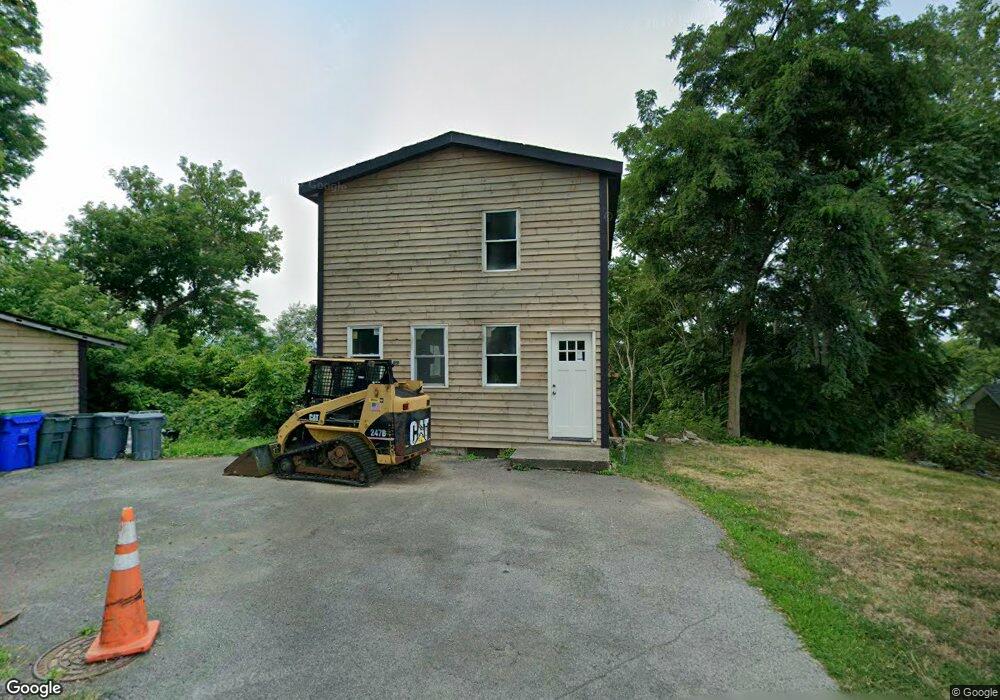
145 N 2nd St Lewiston, NY 14092
Estimated Value: $150,903 - $273,000
2
Beds
1
Bath
780
Sq Ft
$265/Sq Ft
Est. Value
About This Home
This home is located at 145 N 2nd St, Lewiston, NY 14092 and is currently estimated at $206,726, approximately $265 per square foot. 145 N 2nd St is a home located in Niagara County with nearby schools including Primary Education Center, Intermediate Education Center, and Lewiston Porter Middle School.
Ownership History
Date
Name
Owned For
Owner Type
Purchase Details
Closed on
Sep 9, 2010
Sold by
The County Of Niagara New York
Bought by
Finkbeiner Edward G and Finkbeiner Diane J
Current Estimated Value
Purchase Details
Closed on
Jul 8, 2010
Sold by
Andrews Kyle R
Bought by
County Of Niagara New York
Purchase Details
Closed on
Oct 5, 2005
Sold by
Finkbeiner Trust
Bought by
Finkbeiner Edward
Home Financials for this Owner
Home Financials are based on the most recent Mortgage that was taken out on this home.
Original Mortgage
$50,000
Interest Rate
5.81%
Mortgage Type
Credit Line Revolving
Purchase Details
Closed on
Oct 15, 2003
Sold by
Samuel Burruano
Bought by
Finkbeiner Trust
Purchase Details
Closed on
Oct 30, 1995
Sold by
Hillman Carl R Hillman Patrici
Bought by
Burruano Samuel
Purchase Details
Closed on
Jul 18, 1995
Sold by
County Of Niagara
Bought by
Hillman Carl R-Patricia
Create a Home Valuation Report for This Property
The Home Valuation Report is an in-depth analysis detailing your home's value as well as a comparison with similar homes in the area
Home Values in the Area
Average Home Value in this Area
Purchase History
| Date | Buyer | Sale Price | Title Company |
|---|---|---|---|
| Finkbeiner Edward G | $7,687 | None Available | |
| County Of Niagara New York | -- | None Available | |
| Finkbeiner Edward | -- | Renee Mayer | |
| Finkbeiner Trust | $50,000 | Katherine Phufas | |
| Burruano Samuel | $15,000 | -- | |
| Hillman Carl R-Patricia | $11,362 | -- |
Source: Public Records
Mortgage History
| Date | Status | Borrower | Loan Amount |
|---|---|---|---|
| Previous Owner | Finkbeiner Edward | $50,000 |
Source: Public Records
Tax History Compared to Growth
Tax History
| Year | Tax Paid | Tax Assessment Tax Assessment Total Assessment is a certain percentage of the fair market value that is determined by local assessors to be the total taxable value of land and additions on the property. | Land | Improvement |
|---|---|---|---|---|
| 2024 | $2,370 | $50,000 | $13,600 | $36,400 |
| 2023 | $2,370 | $50,000 | $13,600 | $36,400 |
| 2022 | $2,342 | $50,000 | $13,600 | $36,400 |
| 2021 | $2,318 | $50,000 | $13,600 | $36,400 |
| 2020 | $2,294 | $50,000 | $13,600 | $36,400 |
| 2019 | $3,970 | $50,000 | $13,600 | $36,400 |
| 2018 | $3,997 | $50,000 | $13,600 | $36,400 |
| 2017 | $3,970 | $50,000 | $13,600 | $36,400 |
| 2016 | $3,952 | $50,000 | $13,600 | $36,400 |
| 2015 | -- | $50,000 | $13,600 | $36,400 |
| 2014 | -- | $50,000 | $13,600 | $36,400 |
Source: Public Records
Map
Nearby Homes