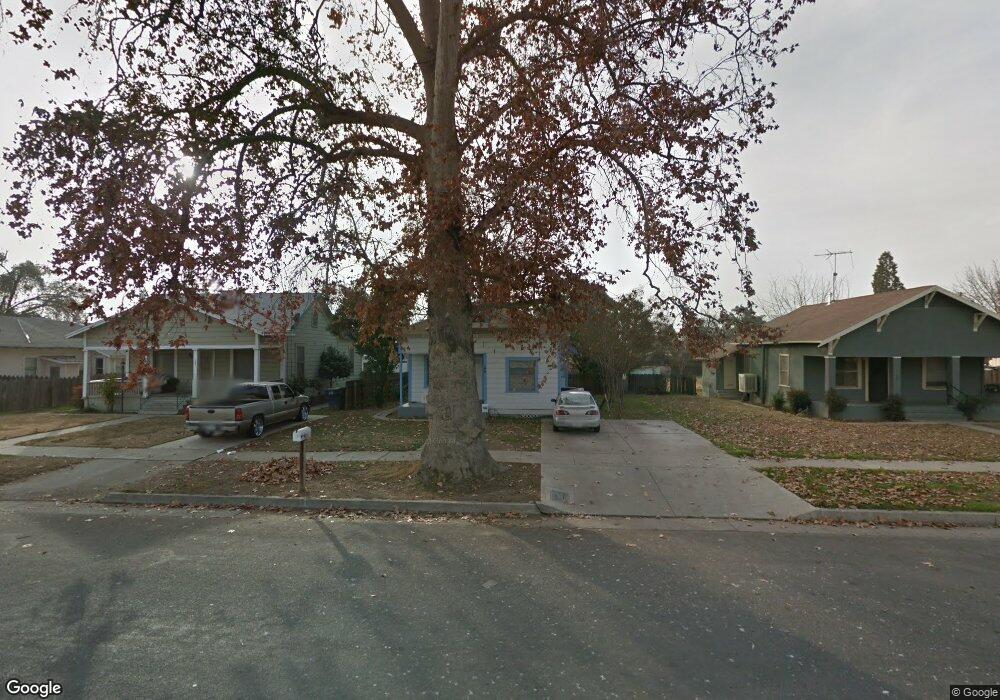
145 S F St Tulare, CA 93274
Estimated Value: $130,000 - $254,000
3
Beds
1
Bath
1,179
Sq Ft
$173/Sq Ft
Est. Value
About This Home
This home is located at 145 S F St, Tulare, CA 93274 and is currently estimated at $203,479, approximately $172 per square foot. 145 S F St is a home located in Tulare County with nearby schools including Maple Elementary School, Mulcahy Middle School, and Tulare Western High School.
Ownership History
Date
Name
Owned For
Owner Type
Purchase Details
Closed on
Oct 16, 2023
Sold by
Secrest Stephen Charles
Bought by
Stephen C Secrest Trust and Secrest
Current Estimated Value
Purchase Details
Closed on
Jul 13, 2004
Sold by
Stanley Cary W and Stanley Connie F
Bought by
Stanley Dennis W and Stanley Kari Diane
Home Financials for this Owner
Home Financials are based on the most recent Mortgage that was taken out on this home.
Original Mortgage
$1,200,000
Interest Rate
6.27%
Mortgage Type
Purchase Money Mortgage
Purchase Details
Closed on
Feb 22, 2001
Sold by
Dredge W Lynn
Bought by
Secrest Steve
Create a Home Valuation Report for This Property
The Home Valuation Report is an in-depth analysis detailing your home's value as well as a comparison with similar homes in the area
Home Values in the Area
Average Home Value in this Area
Purchase History
| Date | Buyer | Sale Price | Title Company |
|---|---|---|---|
| Stephen C Secrest Trust | -- | None Listed On Document | |
| Stanley Dennis W | $50,000 | Chicago Title Co | |
| Secrest Steve | $25,500 | Chicago Title Co |
Source: Public Records
Mortgage History
| Date | Status | Borrower | Loan Amount |
|---|---|---|---|
| Previous Owner | Stanley Dennis W | $1,200,000 |
Source: Public Records
Tax History
| Year | Tax Paid | Tax Assessment Tax Assessment Total Assessment is a certain percentage of the fair market value that is determined by local assessors to be the total taxable value of land and additions on the property. | Land | Improvement |
|---|---|---|---|---|
| 2025 | $902 | $82,877 | $22,601 | $60,276 |
| 2024 | $902 | $81,253 | $22,158 | $59,095 |
| 2023 | $879 | $79,661 | $21,724 | $57,937 |
| 2022 | $853 | $78,100 | $21,299 | $56,801 |
| 2021 | $843 | $76,568 | $20,881 | $55,687 |
| 2020 | $857 | $75,783 | $20,667 | $55,116 |
| 2019 | $878 | $74,297 | $20,262 | $54,035 |
| 2018 | $864 | $72,840 | $19,865 | $52,975 |
| 2017 | $856 | $71,411 | $19,475 | $51,936 |
| 2016 | $819 | $70,011 | $19,093 | $50,918 |
| 2015 | $761 | $68,959 | $18,806 | $50,153 |
| 2014 | $761 | $65,000 | $16,000 | $49,000 |
Source: Public Records
Map
Nearby Homes
- 234 S D St
- 129 S C St
- 257 N F St
- 348 N F St
- 0 0 Unit CV26015491
- 707 W Sonora Ave
- 947 W Kern Ave
- 560 N F St
- 202 N L St
- 1112 W San Joaquin Ave
- 1141 W San Joaquin Ave
- 620 Mariposa Ave
- 605 Catalina Cir
- 748 S Walter St
- 615 Catalina Cir
- 537 S Los Angeles St
- 428 Napa St
- 1969 Oak Falls Ct
- 1922 Oak Falls Ct Unit 5 Wo
- 1982 Oak Falls Ct Unit 1 Wo
Your Personal Tour Guide
Ask me questions while you tour the home.