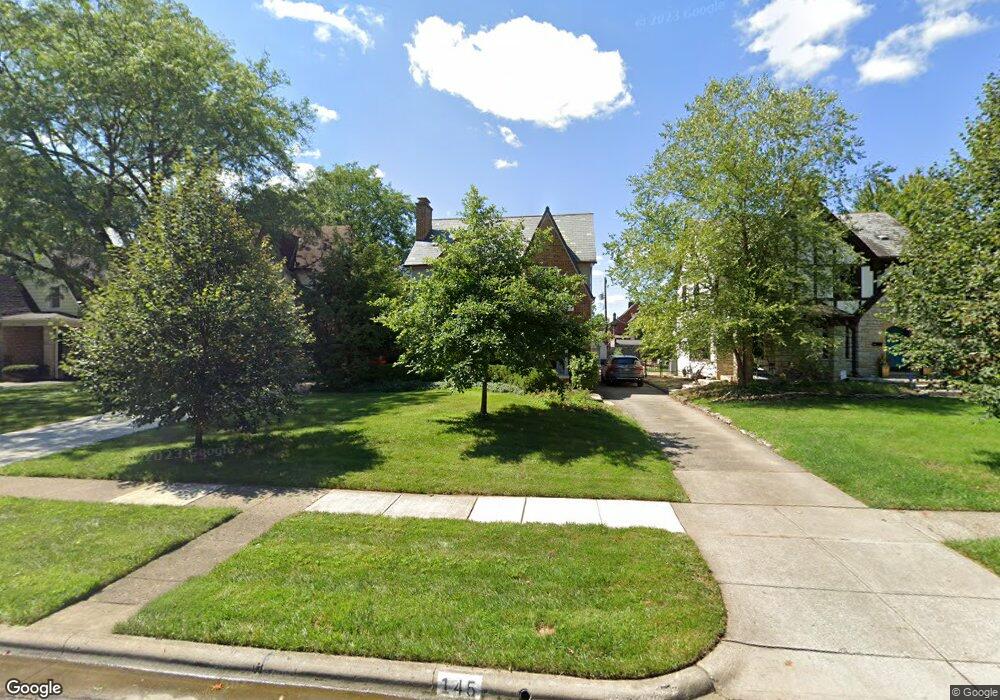
145 S Remington Rd Columbus, OH 43209
Estimated Value: $861,000 - $1,039,000
4
Beds
4
Baths
3,367
Sq Ft
$286/Sq Ft
Est. Value
About This Home
This home is located at 145 S Remington Rd, Columbus, OH 43209 and is currently estimated at $962,737, approximately $285 per square foot. 145 S Remington Rd is a home located in Franklin County with nearby schools including Cassingham Elementary School, Bexley Middle School, and Bexley High School.
Ownership History
Date
Name
Owned For
Owner Type
Purchase Details
Closed on
May 25, 2004
Sold by
Razek Scott and Razek Kara M
Bought by
Johnson Kent S and Thomson Gillian L
Current Estimated Value
Home Financials for this Owner
Home Financials are based on the most recent Mortgage that was taken out on this home.
Original Mortgage
$285,000
Outstanding Balance
$139,225
Interest Rate
5.99%
Mortgage Type
Purchase Money Mortgage
Estimated Equity
$823,512
Purchase Details
Closed on
Jul 15, 2002
Sold by
Cal Development Inc
Bought by
Razek Scott and Razek Scott E
Home Financials for this Owner
Home Financials are based on the most recent Mortgage that was taken out on this home.
Original Mortgage
$290,000
Interest Rate
6.79%
Purchase Details
Closed on
Aug 31, 2001
Sold by
Williams Donald R and Williams Sharan A
Bought by
Cal Development Inc
Purchase Details
Closed on
Jul 16, 2001
Sold by
Williams Donald R
Bought by
Williams Donald R and Williams Sharan A
Purchase Details
Closed on
Feb 7, 1975
Bought by
Williams Donald R
Create a Home Valuation Report for This Property
The Home Valuation Report is an in-depth analysis detailing your home's value as well as a comparison with similar homes in the area
Home Values in the Area
Average Home Value in this Area
Purchase History
| Date | Buyer | Sale Price | Title Company |
|---|---|---|---|
| Johnson Kent S | $480,600 | Stewart Title Agency Of Colu | |
| Razek Scott | $390,000 | Ohio Title Agency | |
| Cal Development Inc | $195,000 | Benchmark Title Agency Inc | |
| Williams Donald R | -- | -- | |
| Williams Donald R | -- | -- |
Source: Public Records
Mortgage History
| Date | Status | Borrower | Loan Amount |
|---|---|---|---|
| Open | Johnson Kent S | $285,000 | |
| Closed | Razek Scott | $290,000 |
Source: Public Records
Tax History Compared to Growth
Tax History
| Year | Tax Paid | Tax Assessment Tax Assessment Total Assessment is a certain percentage of the fair market value that is determined by local assessors to be the total taxable value of land and additions on the property. | Land | Improvement |
|---|---|---|---|---|
| 2024 | $14,218 | $256,030 | $70,320 | $185,710 |
| 2023 | $12,783 | $256,025 | $70,315 | $185,710 |
| 2022 | $14,552 | $234,080 | $42,910 | $191,170 |
| 2021 | $14,564 | $234,080 | $42,910 | $191,170 |
| 2020 | $14,435 | $234,080 | $42,910 | $191,170 |
| 2019 | $13,635 | $194,530 | $35,770 | $158,760 |
| 2018 | $11,438 | $194,530 | $35,770 | $158,760 |
| 2017 | $11,562 | $194,530 | $35,770 | $158,760 |
| 2016 | $10,996 | $169,060 | $32,940 | $136,120 |
| 2015 | $11,029 | $169,060 | $32,940 | $136,120 |
| 2014 | $11,092 | $169,060 | $32,940 | $136,120 |
| 2013 | $5,240 | $153,650 | $29,925 | $123,725 |
Source: Public Records
Map
Nearby Homes
- 208 S Stanwood Rd
- 2629 E Broad St
- 268 S Cassady Ave
- 2717 E Broad St
- 2731 E Broad St
- 2738 E Broad St
- 2455 Dale Ave
- 49 N Cassingham Rd
- 123 S Gould Rd
- 142 S Gould Rd
- 96 N Cassingham Rd
- 50 S Chesterfield Rd
- 2564 Sherwood Rd
- 2425 Bryden Rd
- 50 N Broadleigh Rd
- 2424 Sherwood Rd
- 47 N Chesterfield Rd
- 563 S Dawson Ave
- 205 N Gould Rd
- 291 N Drexel Ave
- 139 S Remington Rd
- 151 S Remington Rd
- 133 S Remington Rd
- 155 S Remington Rd
- 127 S Remington Rd
- 165 S Remington Rd
- 140 S Cassingham Rd
- 146 S Cassingham Rd
- 134 S Cassingham Rd
- 126 S Cassingham Rd
- 150 S Cassingham Rd
- 119 S Remington Rd
- 171 S Remington Rd
- 120 S Cassingham Rd
- 120 S Cassingham Rd Unit BEXLEY
- 158 S Cassingham Rd
- 148 S Remington Rd
- 142 S Remington Rd
- 156 S Remington Rd
- 162 S Remington Rd