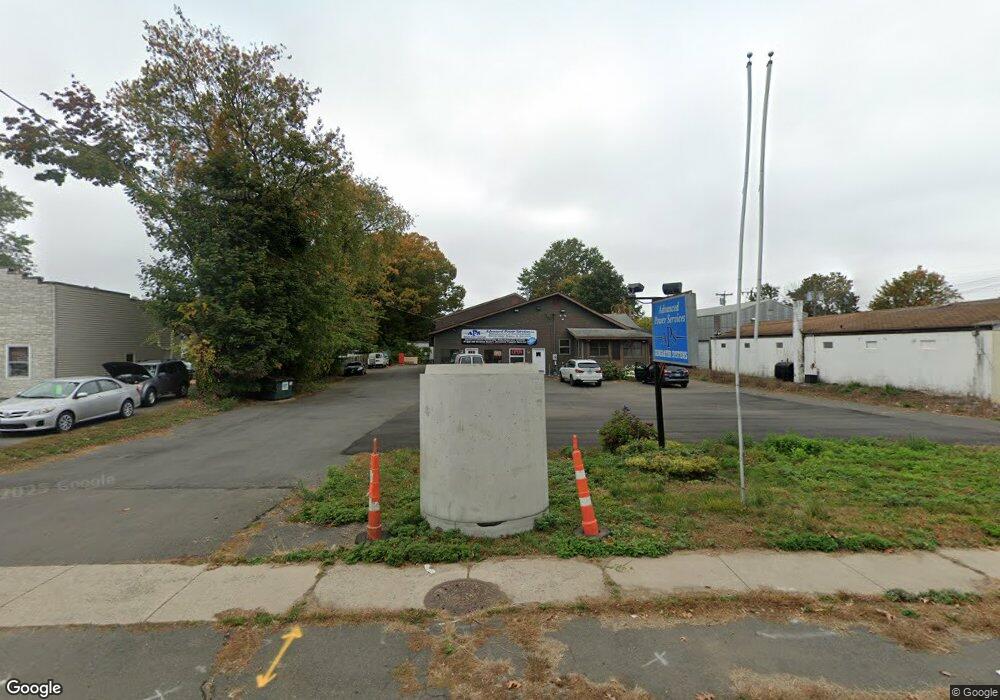
145 Whiting St Plainville, CT 06062
Estimated Value: $709,996
--
Bed
--
Bath
4,544
Sq Ft
$156/Sq Ft
Est. Value
About This Home
This home is located at 145 Whiting St, Plainville, CT 06062 and is currently estimated at $709,996, approximately $156 per square foot. 145 Whiting St is a home located in Hartford County with nearby schools including Middle School Of Plainville, Plainville High School, and Miss Porter's School.
Ownership History
Date
Name
Owned For
Owner Type
Purchase Details
Closed on
Dec 10, 2019
Sold by
Guevara Realty Llc
Bought by
Advanced Power Ents Llc
Current Estimated Value
Purchase Details
Closed on
Dec 28, 2012
Sold by
145 Whiting Llc
Bought by
Guevara Realty Llc
Home Financials for this Owner
Home Financials are based on the most recent Mortgage that was taken out on this home.
Original Mortgage
$200,000
Interest Rate
3.38%
Mortgage Type
Commercial
Purchase Details
Closed on
Mar 11, 2011
Sold by
Parent Gemma G and Parent Joseph A
Bought by
145 Whiting Llc
Purchase Details
Closed on
May 27, 1993
Sold by
Sullivan Frank Est
Bought by
Benson Kurt
Purchase Details
Closed on
Jun 27, 1988
Sold by
Ibitz Frank
Bought by
Sullivan Frank
Purchase Details
Closed on
May 16, 1987
Sold by
Czerepak Julia
Bought by
Parent Joseph
Create a Home Valuation Report for This Property
The Home Valuation Report is an in-depth analysis detailing your home's value as well as a comparison with similar homes in the area
Home Values in the Area
Average Home Value in this Area
Purchase History
| Date | Buyer | Sale Price | Title Company |
|---|---|---|---|
| Advanced Power Ents Llc | $413,000 | None Available | |
| Advanced Power Ents Llc | $413,000 | None Available | |
| Guevara Realty Llc | $400,000 | -- | |
| Guevara Realty Llc | $400,000 | -- | |
| 145 Whiting Llc | -- | -- | |
| 145 Whiting Llc | -- | -- | |
| Benson Kurt | $118,200 | -- | |
| Benson Kurt | $118,200 | -- | |
| Sullivan Frank | $210,000 | -- | |
| Parent Joseph | $170,000 | -- |
Source: Public Records
Mortgage History
| Date | Status | Borrower | Loan Amount |
|---|---|---|---|
| Previous Owner | Parent Joseph | $200,000 | |
| Previous Owner | Parent Joseph | $200,000 |
Source: Public Records
Tax History Compared to Growth
Tax History
| Year | Tax Paid | Tax Assessment Tax Assessment Total Assessment is a certain percentage of the fair market value that is determined by local assessors to be the total taxable value of land and additions on the property. | Land | Improvement |
|---|---|---|---|---|
| 2025 | $8,478 | $246,750 | $70,210 | $176,540 |
| 2024 | $8,054 | $246,750 | $70,210 | $176,540 |
| 2023 | $7,753 | $246,750 | $70,210 | $176,540 |
| 2022 | $7,560 | $246,750 | $70,210 | $176,540 |
| 2021 | $7,870 | $227,710 | $58,520 | $169,190 |
| 2020 | $7,883 | $227,710 | $58,520 | $169,190 |
| 2019 | $7,883 | $227,710 | $58,520 | $169,190 |
| 2018 | $7,706 | $227,710 | $58,520 | $169,190 |
| 2017 | $7,442 | $227,710 | $58,520 | $169,190 |
| 2016 | $5,536 | $173,040 | $58,520 | $114,520 |
| 2015 | $5,508 | $173,040 | $58,520 | $114,520 |
| 2014 | $5,608 | $178,710 | $58,520 | $120,190 |
Source: Public Records
Map
Nearby Homes
- 11 Oakwood Cir
- 180 S Washington St Unit 12
- 50 Pierce St Unit 56
- 50 Pierce St Unit 65
- 49 Lincoln St
- 31 E Broad St
- 16 1/2 E Maple St
- 17 Laurel St
- 452 East St
- 117 Hollyberry Ln
- 9 Pinecrest Dr
- 77 E Main St
- 10 Terra Rd
- 26 Skyline Dr
- 34 Skyline Dr
- 14 Mckernan Dr
- 4 Testa Dr
- 97 Dallas Ave Unit A4
- 71 Luciano Dr
- 20 Macarthur Rd
- 27 Homestead Ave
- 35 Homestead Ave
- 141 Whiting St
- 143 Whiting St
- 17 Homestead Ave
- 45 Homestead Ave
- 15 Homestead Ave
- 26 Homestead Ave
- 24 Homestead Ave
- 30 Homestead Ave
- 53 Homestead Ave
- 55 Homestead Ave
- 40 Homestead Ave
- 139 Whiting St
- 42 Homestead Ave
- 59 Homestead Ave
- 48 Homestead Ave
- 155A Whiting St
- 155 Whiting St
- 161 Whiting St