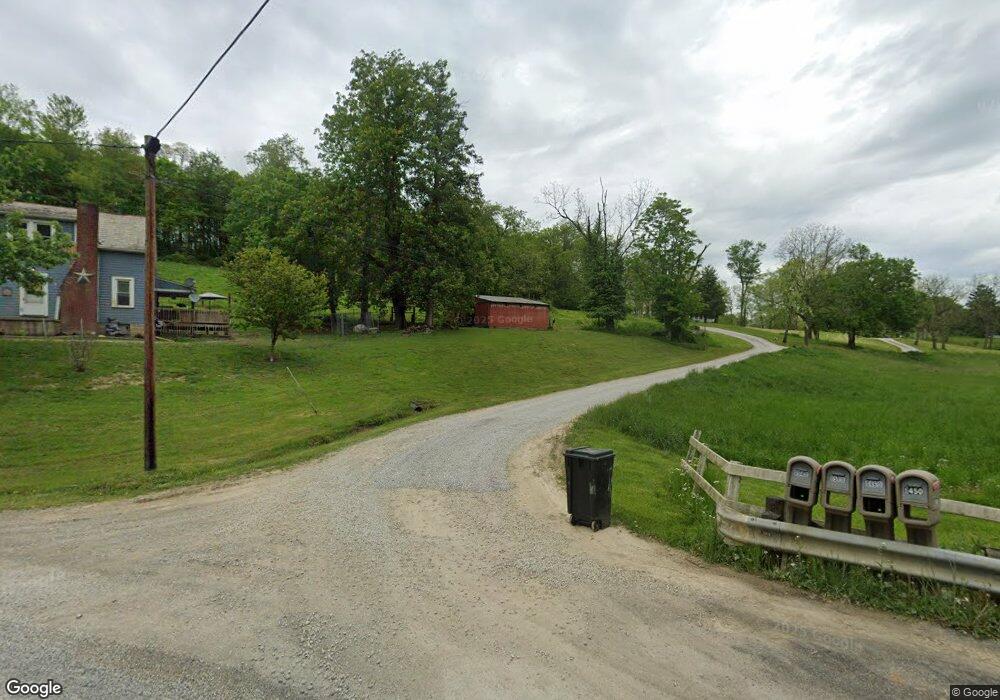
1450 Lower Bloomfield Rd New Concord, OH 43762
Estimated Value: $287,000 - $469,277
2
Beds
1
Bath
1,440
Sq Ft
$256/Sq Ft
Est. Value
About This Home
This home is located at 1450 Lower Bloomfield Rd, New Concord, OH 43762 and is currently estimated at $368,426, approximately $255 per square foot. 1450 Lower Bloomfield Rd is a home with nearby schools including New Concord Elementary School, Larry Miller Intermediate Elementary School, and East Muskingum Middle School.
Ownership History
Date
Name
Owned For
Owner Type
Purchase Details
Closed on
Jul 25, 2008
Sold by
Bates Jeffrey
Bought by
Bates Thomas Jeffrey and Baker Staci J
Current Estimated Value
Home Financials for this Owner
Home Financials are based on the most recent Mortgage that was taken out on this home.
Original Mortgage
$152,500
Outstanding Balance
$99,819
Interest Rate
6.36%
Mortgage Type
Unknown
Estimated Equity
$268,607
Purchase Details
Closed on
Jun 20, 2008
Sold by
Jirles Sherry and Kornocovich Mary
Bought by
Bates Jeffrey
Home Financials for this Owner
Home Financials are based on the most recent Mortgage that was taken out on this home.
Original Mortgage
$152,500
Outstanding Balance
$99,819
Interest Rate
6.36%
Mortgage Type
Unknown
Estimated Equity
$268,607
Purchase Details
Closed on
Aug 26, 1996
Sold by
Fitzgerald Dale
Bought by
Baker Kenneth E and Baker J
Create a Home Valuation Report for This Property
The Home Valuation Report is an in-depth analysis detailing your home's value as well as a comparison with similar homes in the area
Home Values in the Area
Average Home Value in this Area
Purchase History
| Date | Buyer | Sale Price | Title Company |
|---|---|---|---|
| Bates Thomas Jeffrey | -- | Attorney | |
| Bates Jeffrey | $150,000 | None Available | |
| Baker Kenneth E | $1,300 | -- |
Source: Public Records
Mortgage History
| Date | Status | Borrower | Loan Amount |
|---|---|---|---|
| Open | Bates Thomas Jeffrey | $152,500 | |
| Closed | Bates Jeffrey | $149,680 |
Source: Public Records
Tax History Compared to Growth
Tax History
| Year | Tax Paid | Tax Assessment Tax Assessment Total Assessment is a certain percentage of the fair market value that is determined by local assessors to be the total taxable value of land and additions on the property. | Land | Improvement |
|---|---|---|---|---|
| 2024 | $1,768 | $120,470 | $81,725 | $38,745 |
| 2023 | $1,063 | $83,720 | $62,020 | $21,700 |
| 2022 | $1,044 | $83,720 | $62,020 | $21,700 |
| 2021 | $1,031 | $83,720 | $62,020 | $21,700 |
| 2020 | $1,105 | $83,720 | $62,020 | $21,700 |
| 2019 | $1,099 | $83,720 | $62,020 | $21,700 |
| 2018 | $1,059 | $83,720 | $62,020 | $21,700 |
| 2017 | $968 | $59,640 | $44,975 | $14,665 |
| 2016 | $970 | $59,650 | $44,980 | $14,670 |
| 2015 | $994 | $59,650 | $44,980 | $14,670 |
| 2013 | $946 | $59,650 | $44,980 | $14,670 |
Source: Public Records
Map
Nearby Homes
- 12985 John Glenn School Rd
- 110 Cherry Ln
- 8 E Main St
- 112 Thompson Ave
- 67 E Main St
- 1420 Glenn Hwy
- 0 Maple Ln
- Lot 18 & 19 Greenbriar Dr
- 0 Homestead Dr Unit 11611647
- 0 Homestead Dr Unit 5174212
- 0 Rix Mills Rd
- 61220 Kadon Dr
- 3029 Best Rd
- 60040 Bliss Rd
- 0 Norfield Unit 5174011
- 0 Norfield Unit 5173946
- 3859 Mayfair Ln
- 135 S Moose Eye Rd
- 0 Bloomfield Rd
- 101 N Sundale Rd
- 1460 Lower Bloomfield Rd
- 1510 Lower Bloomfield Rd
- 181 Lowery Ln
- 1320 Lower Bloomfield Rd
- 1550 Lower Bloomfield Rd
- 0 Lower Bloomfield Rd
- 183 N Liberty St
- 177 Lowery Ln
- 179 N Liberty St
- 13506 John Glenn School Rd
- 178 Lowery Ln
- 181 N Liberty St
- 0 N Liberty St Unit 3409775
- 175 Lowery Ln
- 205 Lakeside Dr
- 54 Paden Rd
- 177 N Liberty St
- 203 Lakeside Dr
- 173 Lowery Ln
- 110 Eastview Dr