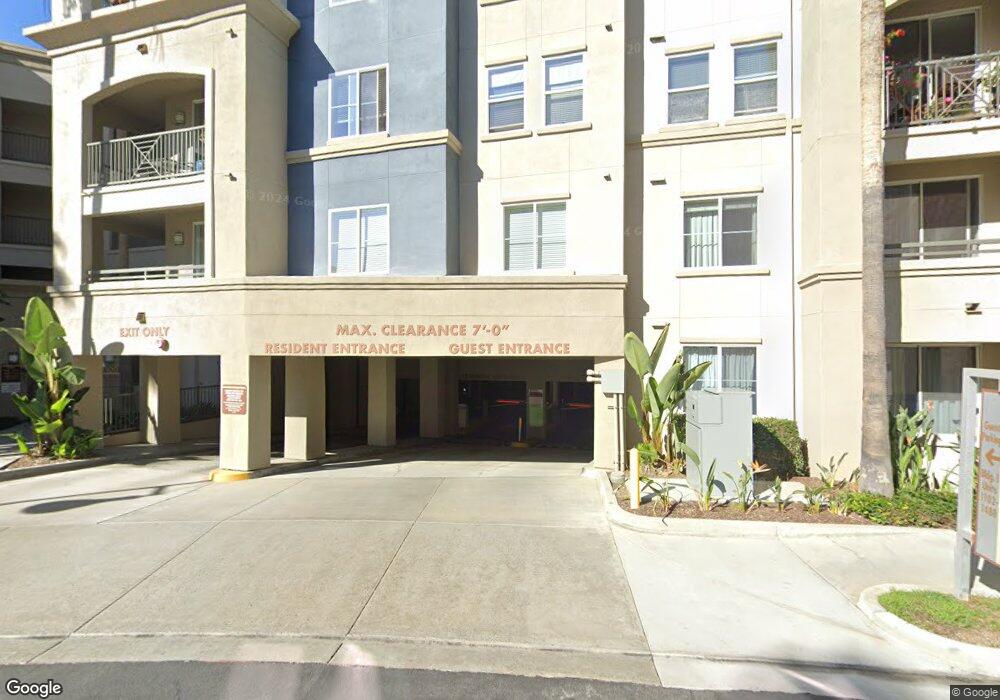
1450 Scholarship Irvine, CA 92612
University Park and Town Center NeighborhoodEstimated Value: $642,918 - $862,000
1
Bed
1
Bath
895
Sq Ft
$806/Sq Ft
Est. Value
About This Home
This home is located at 1450 Scholarship, Irvine, CA 92612 and is currently estimated at $721,730, approximately $806 per square foot. 1450 Scholarship is a home located in Orange County with nearby schools including Monroe Elementary School, McFadden Institute of Technology, and Century High School.
Ownership History
Date
Name
Owned For
Owner Type
Purchase Details
Closed on
Mar 7, 2019
Sold by
Tanoue Kristine and Tonoue Kristine
Bought by
Tanoue Kristine
Current Estimated Value
Purchase Details
Closed on
Feb 5, 2010
Sold by
Kloster Michael J and Kloster Julie
Bought by
Tonoue Kristine
Home Financials for this Owner
Home Financials are based on the most recent Mortgage that was taken out on this home.
Original Mortgage
$224,000
Outstanding Balance
$147,581
Interest Rate
4.94%
Mortgage Type
New Conventional
Estimated Equity
$574,149
Purchase Details
Closed on
Jan 1, 2008
Sold by
K Hovnanian At Avenue One Llc
Bought by
Kloster Michael J and Kloster Julie
Home Financials for this Owner
Home Financials are based on the most recent Mortgage that was taken out on this home.
Original Mortgage
$322,050
Interest Rate
6%
Mortgage Type
Unknown
Create a Home Valuation Report for This Property
The Home Valuation Report is an in-depth analysis detailing your home's value as well as a comparison with similar homes in the area
Home Values in the Area
Average Home Value in this Area
Purchase History
| Date | Buyer | Sale Price | Title Company |
|---|---|---|---|
| Tanoue Kristine | -- | Accommodation | |
| Tonoue Kristine | $280,000 | Advantage Title Inc | |
| Kloster Michael J | $358,000 | First American Title Ins Co |
Source: Public Records
Mortgage History
| Date | Status | Borrower | Loan Amount |
|---|---|---|---|
| Open | Tonoue Kristine | $224,000 | |
| Previous Owner | Kloster Michael J | $322,050 |
Source: Public Records
Tax History Compared to Growth
Tax History
| Year | Tax Paid | Tax Assessment Tax Assessment Total Assessment is a certain percentage of the fair market value that is determined by local assessors to be the total taxable value of land and additions on the property. | Land | Improvement |
|---|---|---|---|---|
| 2025 | $3,939 | $361,423 | $139,433 | $221,990 |
| 2024 | $3,939 | $354,337 | $136,699 | $217,638 |
| 2023 | $3,843 | $347,390 | $134,019 | $213,371 |
| 2022 | $3,806 | $340,579 | $131,391 | $209,188 |
| 2021 | $3,712 | $333,901 | $128,814 | $205,087 |
| 2020 | $3,721 | $330,478 | $127,493 | $202,985 |
| 2019 | $3,642 | $323,999 | $124,994 | $199,005 |
| 2018 | $3,491 | $317,647 | $122,544 | $195,103 |
| 2017 | $3,460 | $311,419 | $120,141 | $191,278 |
| 2016 | $3,389 | $305,313 | $117,785 | $187,528 |
| 2015 | $3,305 | $300,727 | $116,015 | $184,712 |
| 2014 | $3,247 | $294,837 | $113,743 | $181,094 |
Source: Public Records
Map
Nearby Homes
- 2380 Scholarship
- 8145 Scholarship
- 5100 Scholarship
- 8154 Scholarship
- 5082 Scholarship
- 1430 Scholarship
- 8050 Scholarship
- 8081 Scholarship
- 8049 Scholarship
- 3207 Watermarke Place
- 3270 Watermarke Place
- 2258 Scholarship
- 1327 Scholarship
- 3131 Watermarke Place
- 3247 Watermarke Place
- 2257 Watermarke Place
- 1106 Scholarship
- 2311 Watermarke Place
- 3339 Watermarke Place
- 3311 Watermarke Place
- 1436 Scholarship
- 1438 Scholarship
- 1438 Scholarship
- 1434 Scholarship Unit 1
- 1434 Scholarship Unit 303
- 1432 Scholarship
- 1433 Scholarship
- 1440 Scholarship
- 1428 Scholarship
- 1429 Scholarship
- 1431 Scholarship
- 1424 Scholarship
- 1426 Scholarship
- 1425 Scholarship
- 1427 Scholarship
- 1446 Scholarship Unit 308
- 1448 Scholarship
- 1452 Scholarship
- 1418 Scholarship
- 1442 Scholarship