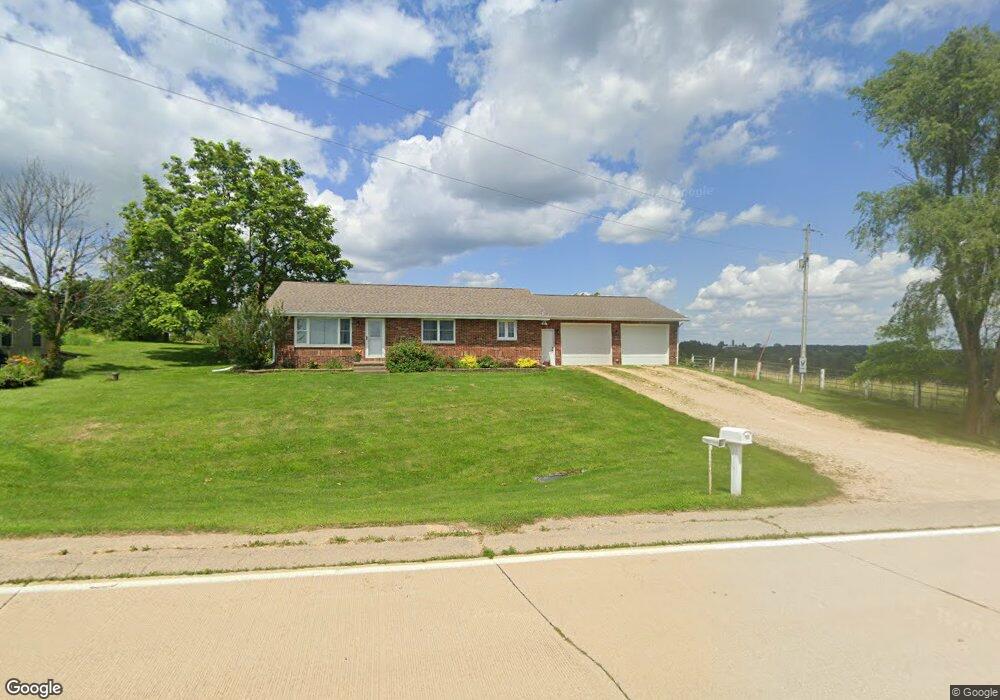
14503 Higginsport Rd Bernard, IA 52032
Estimated Value: $291,000 - $449,944
3
Beds
4
Baths
1,260
Sq Ft
$299/Sq Ft
Est. Value
About This Home
This home is located at 14503 Higginsport Rd, Bernard, IA 52032 and is currently estimated at $376,986, approximately $299 per square foot. 14503 Higginsport Rd is a home located in Dubuque County with nearby schools including Table Mound Elementary School, Eleanor Roosevelt Middle School, and Dubuque Senior High School.
Ownership History
Date
Name
Owned For
Owner Type
Purchase Details
Closed on
Aug 18, 2022
Sold by
John J Lyons Trust
Bought by
Lyons Steven J and Lyons Lynn
Current Estimated Value
Purchase Details
Closed on
Jul 22, 2021
Sold by
Lynch Jeremiah M and Lynch Jeremiah M
Bought by
Lyons Travis M and Lyons Brianna J
Purchase Details
Closed on
May 15, 2015
Sold by
Lyons Craig S and Lyons Rachel K
Bought by
Lyons Travis M and Lyons Brianna J
Home Financials for this Owner
Home Financials are based on the most recent Mortgage that was taken out on this home.
Original Mortgage
$70,000
Interest Rate
3.62%
Mortgage Type
New Conventional
Purchase Details
Closed on
Nov 30, 2011
Sold by
Lyons John J
Bought by
Lyons Craig S and Lyons Rachel K
Purchase Details
Closed on
Dec 30, 2005
Sold by
Lyons John J
Bought by
Lyons Craig S and Lyons Rachel K
Create a Home Valuation Report for This Property
The Home Valuation Report is an in-depth analysis detailing your home's value as well as a comparison with similar homes in the area
Home Values in the Area
Average Home Value in this Area
Purchase History
| Date | Buyer | Sale Price | Title Company |
|---|---|---|---|
| Lyons Steven J | -- | Oconnor & Thomas Pc | |
| Lyons Travis M | $13,000 | None Available | |
| Lyons Travis M | $140,000 | None Available | |
| Lyons Craig S | $38,000 | None Available | |
| Lyons Craig S | $38,000 | None Available | |
| Lyons John J | -- | None Available |
Source: Public Records
Mortgage History
| Date | Status | Borrower | Loan Amount |
|---|---|---|---|
| Previous Owner | Lyons Travis M | $70,000 |
Source: Public Records
Tax History Compared to Growth
Tax History
| Year | Tax Paid | Tax Assessment Tax Assessment Total Assessment is a certain percentage of the fair market value that is determined by local assessors to be the total taxable value of land and additions on the property. | Land | Improvement |
|---|---|---|---|---|
| 2025 | $3,784 | $350,500 | $156,400 | $194,100 |
| 2024 | $3,784 | $323,500 | $148,900 | $174,600 |
| 2023 | $3,658 | $323,500 | $148,900 | $174,600 |
| 2022 | $3,280 | $241,280 | $114,550 | $126,730 |
| 2021 | $3,280 | $241,280 | $114,550 | $126,730 |
| 2020 | $3,208 | $215,890 | $99,800 | $116,090 |
| 2019 | $2,898 | $219,950 | $105,400 | $114,550 |
| 2018 | $2,828 | $191,260 | $89,000 | $102,260 |
| 2017 | $2,762 | $191,260 | $89,000 | $102,260 |
| 2016 | $2,762 | $177,570 | $78,900 | $98,670 |
| 2015 | $2,686 | $177,570 | $78,900 | $98,670 |
| 2014 | $2,306 | $166,680 | $72,400 | $94,280 |
Source: Public Records
Map
Nearby Homes