1451 88th Ave Oakland, CA 94621
Webster NeighborhoodEstimated Value: $545,000 - $593,000
4
Beds
2
Baths
1,578
Sq Ft
$361/Sq Ft
Est. Value
About This Home
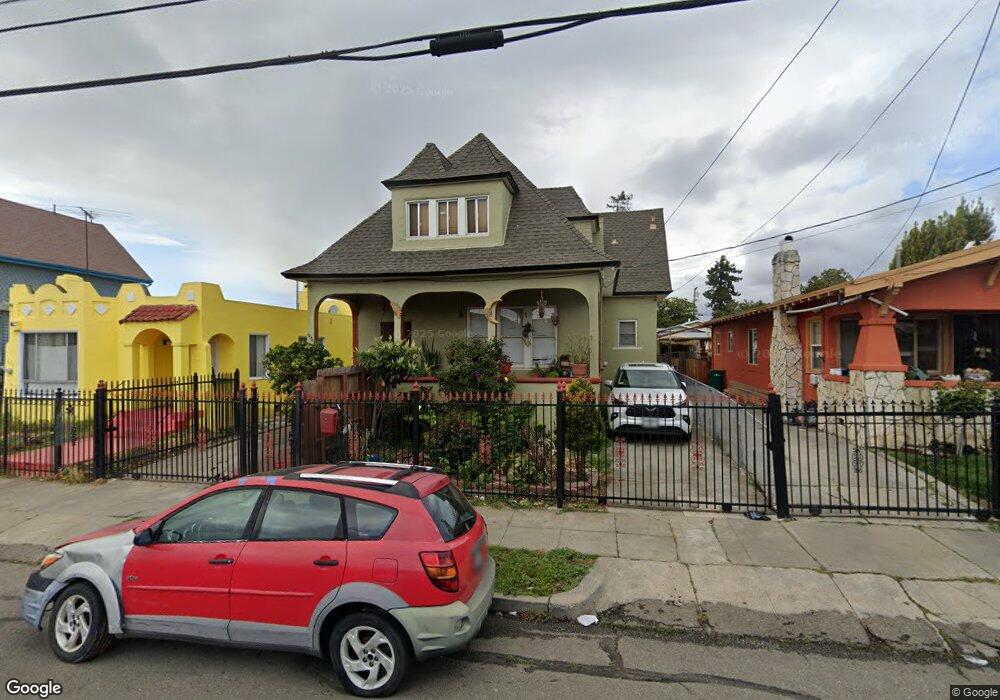
This home is located at 1451 88th Ave, Oakland, CA 94621 and is currently estimated at $569,499, approximately $360 per square foot. 1451 88th Ave is a home located in Alameda County with nearby schools including East Oakland Pride Elementary School, Elmhurst United Middle School, and Coliseum College Prep Academy.
Ownership History
Date
Name
Owned For
Owner Type
Purchase Details
Closed on
Feb 11, 2019
Sold by
Hernandez Gabriela
Bought by
Alvarado Ayala Tiburcio A and Alvarado Ayala Juana
Current Estimated Value
Home Financials for this Owner
Home Financials are based on the most recent Mortgage that was taken out on this home.
Original Mortgage
$436,939
Outstanding Balance
$391,535
Interest Rate
5.5%
Mortgage Type
FHA
Estimated Equity
$177,964
Purchase Details
Closed on
Nov 16, 2012
Sold by
The Bank Of New York Mellon
Bought by
Hernandez Gabriela
Purchase Details
Closed on
Dec 9, 2011
Sold by
Miller George H
Bought by
The Bank Of New York Mellon and The Bank Of New York
Purchase Details
Closed on
May 17, 2006
Sold by
Miller Sandra Renee
Bought by
Miller George H
Home Financials for this Owner
Home Financials are based on the most recent Mortgage that was taken out on this home.
Original Mortgage
$363,750
Interest Rate
2.5%
Mortgage Type
Fannie Mae Freddie Mac
Create a Home Valuation Report for This Property
The Home Valuation Report is an in-depth analysis detailing your home's value as well as a comparison with similar homes in the area
Home Values in the Area
Average Home Value in this Area
Purchase History
| Date | Buyer | Sale Price | Title Company |
|---|---|---|---|
| Alvarado Ayala Tiburcio A | $445,000 | Wfg National Title Ins Co | |
| Hernandez Gabriela | $84,000 | None Available | |
| The Bank Of New York Mellon | $105,525 | Landsafe Title | |
| Miller George H | -- | Financial Title Company |
Source: Public Records
Mortgage History
| Date | Status | Borrower | Loan Amount |
|---|---|---|---|
| Open | Alvarado Ayala Tiburcio A | $436,939 | |
| Previous Owner | Miller George H | $363,750 |
Source: Public Records
Tax History Compared to Growth
Tax History
| Year | Tax Paid | Tax Assessment Tax Assessment Total Assessment is a certain percentage of the fair market value that is determined by local assessors to be the total taxable value of land and additions on the property. | Land | Improvement |
|---|---|---|---|---|
| 2025 | $7,982 | $496,397 | $148,919 | $347,478 |
| 2024 | $7,982 | $486,664 | $145,999 | $340,665 |
| 2023 | $8,468 | $477,124 | $143,137 | $333,987 |
| 2022 | $8,109 | $467,770 | $140,331 | $327,439 |
| 2021 | $7,718 | $458,598 | $137,579 | $321,019 |
| 2020 | $7,633 | $453,900 | $136,170 | $317,730 |
| 2019 | $3,424 | $160,063 | $48,019 | $112,044 |
| 2018 | $3,357 | $156,925 | $47,077 | $109,848 |
| 2017 | $3,199 | $153,848 | $46,154 | $107,694 |
| 2016 | $3,018 | $150,833 | $45,250 | $105,583 |
| 2015 | $3,146 | $148,567 | $44,570 | $103,997 |
| 2014 | $2,940 | $145,657 | $43,697 | $101,960 |
Source: Public Records
Map
Nearby Homes