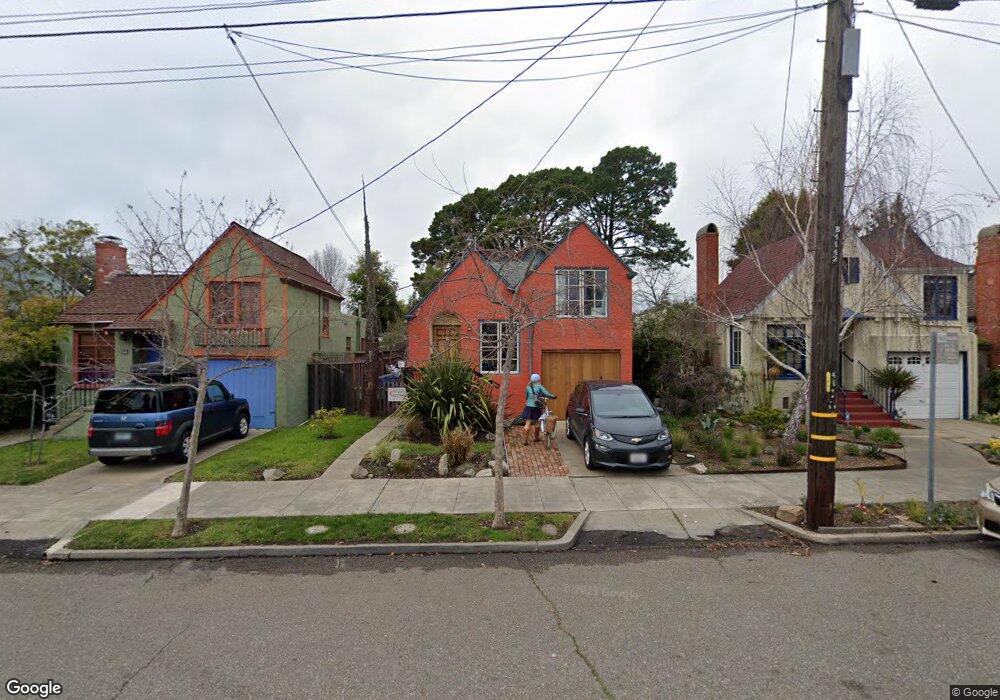
1451 Blake St Berkeley, CA 94702
West Berkeley NeighborhoodEstimated Value: $1,177,000 - $1,948,000
2
Beds
2
Baths
1,992
Sq Ft
$743/Sq Ft
Est. Value
About This Home
This home is located at 1451 Blake St, Berkeley, CA 94702 and is currently estimated at $1,479,665, approximately $742 per square foot. 1451 Blake St is a home located in Alameda County with nearby schools including Washington Elementary School, Oxford Elementary School, and Malcolm X Elementary School.
Ownership History
Date
Name
Owned For
Owner Type
Purchase Details
Closed on
Apr 16, 2021
Sold by
Mcglashan Scott and Mcglashan Kate
Bought by
Mcglashan Kate and Mcglashan Scott
Current Estimated Value
Purchase Details
Closed on
Mar 22, 2002
Sold by
Ealy Elton and Estate Of Herman Lacy
Bought by
Mcglashan Scott and Mcglashan Kate
Home Financials for this Owner
Home Financials are based on the most recent Mortgage that was taken out on this home.
Original Mortgage
$210,000
Outstanding Balance
$86,364
Interest Rate
6.84%
Mortgage Type
Purchase Money Mortgage
Estimated Equity
$1,393,301
Create a Home Valuation Report for This Property
The Home Valuation Report is an in-depth analysis detailing your home's value as well as a comparison with similar homes in the area
Home Values in the Area
Average Home Value in this Area
Purchase History
| Date | Buyer | Sale Price | Title Company |
|---|---|---|---|
| Mcglashan Kate | -- | None Available | |
| Mcglashan Scott | $320,000 | Old Republic Title Company |
Source: Public Records
Mortgage History
| Date | Status | Borrower | Loan Amount |
|---|---|---|---|
| Open | Mcglashan Scott | $210,000 |
Source: Public Records
Tax History
| Year | Tax Paid | Tax Assessment Tax Assessment Total Assessment is a certain percentage of the fair market value that is determined by local assessors to be the total taxable value of land and additions on the property. | Land | Improvement |
|---|---|---|---|---|
| 2025 | $10,724 | $614,700 | $141,811 | $479,889 |
| 2024 | $10,724 | $602,512 | $139,031 | $470,481 |
| 2023 | $10,487 | $597,563 | $136,305 | $461,258 |
| 2022 | $10,267 | $578,847 | $133,632 | $452,215 |
| 2021 | $10,271 | $567,362 | $131,013 | $443,349 |
| 2020 | $9,638 | $568,474 | $129,670 | $438,804 |
| 2019 | $9,171 | $557,330 | $127,128 | $430,202 |
| 2018 | $8,998 | $546,404 | $124,635 | $421,769 |
| 2017 | $8,672 | $535,692 | $122,192 | $413,500 |
| 2016 | $8,335 | $525,192 | $119,797 | $405,395 |
| 2015 | $8,215 | $517,305 | $117,998 | $399,307 |
| 2014 | $8,135 | $507,174 | $115,687 | $391,487 |
Source: Public Records
Map
Nearby Homes
- 1516 Blake St
- 1516 Blake St Unit A
- 1431 Dwight Way
- 2437 Acton St
- 1524 Blake St
- 1515 Derby St
- 2750 Sacramento St
- 1450 Ward St
- 2435 Bonar St
- 2758 Sacramento St
- 1612 Parker St
- 1604 Dwight Way
- 2717 Mabel St
- 2774 Sacramento St
- 2782 Sacramento St
- 2790 Sacramento St
- 2350 Sacramento St
- 1135 Parker St
- 1634 Blake St
- 2304 Edwards St
Your Personal Tour Guide
Ask me questions while you tour the home.