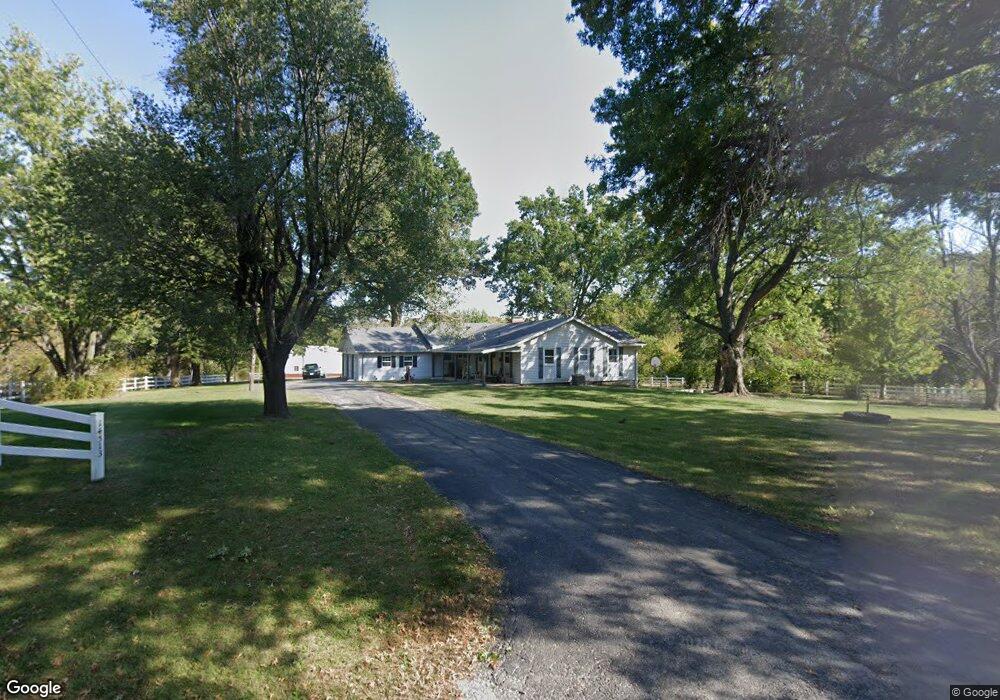
14513 Hedgecock Rd Greenwood, MO 64034
Estimated Value: $555,975 - $685,000
2
Beds
3
Baths
2,040
Sq Ft
$298/Sq Ft
Est. Value
About This Home
This home is located at 14513 Hedgecock Rd, Greenwood, MO 64034 and is currently estimated at $608,658, approximately $298 per square foot. 14513 Hedgecock Rd is a home located in Jackson County with nearby schools including Woodland Elementary School, Pleasant Lea Middle School, and Lee's Summit Senior High School.
Ownership History
Date
Name
Owned For
Owner Type
Purchase Details
Closed on
Aug 8, 2022
Sold by
Goodfellow Gary L and Goodfellow Ann Kimberly
Bought by
Martin Wes and Martin Arnie
Current Estimated Value
Purchase Details
Closed on
Feb 18, 2022
Sold by
Irrevocable Roger and Irrevocable Peggy
Bought by
Martin Amie and Martin Wes
Home Financials for this Owner
Home Financials are based on the most recent Mortgage that was taken out on this home.
Original Mortgage
$363,850
Interest Rate
3.55%
Mortgage Type
New Conventional
Purchase Details
Closed on
Feb 3, 2021
Sold by
Soute Jarret M and Soute Cynthia A
Bought by
Souter Janett M and Souter Cynthia A
Purchase Details
Closed on
Dec 21, 2020
Sold by
Jurgensmeyer Roger S and Jurgensmeyer Peggy M
Bought by
Jurgensmeyer John and Roger & Peggy Jurgensmeyer Irrevocable T
Purchase Details
Closed on
Nov 17, 2016
Sold by
Jurgensmeyer Roger and Jurgensmeyer Peggy M
Bought by
Jurgensmeyer Roger S and Jurgensmeyer Peggy M
Create a Home Valuation Report for This Property
The Home Valuation Report is an in-depth analysis detailing your home's value as well as a comparison with similar homes in the area
Home Values in the Area
Average Home Value in this Area
Purchase History
| Date | Buyer | Sale Price | Title Company |
|---|---|---|---|
| Martin Wes | -- | None Listed On Document | |
| Martin Amie | -- | Chicago Title | |
| Martin Amie | $483,920 | Chicago Title | |
| Souter Janett M | -- | None Available | |
| Jurgensmeyer John | -- | None Available | |
| Jurgensmeyer Roger S | -- | None Available | |
| Jurgensmeyer Roger S | -- | None Available |
Source: Public Records
Mortgage History
| Date | Status | Borrower | Loan Amount |
|---|---|---|---|
| Previous Owner | Martin Amie | $363,850 |
Source: Public Records
Tax History Compared to Growth
Tax History
| Year | Tax Paid | Tax Assessment Tax Assessment Total Assessment is a certain percentage of the fair market value that is determined by local assessors to be the total taxable value of land and additions on the property. | Land | Improvement |
|---|---|---|---|---|
| 2025 | $4,633 | $62,818 | $20,127 | $42,691 |
| 2024 | $4,581 | $67,382 | $26,760 | $40,622 |
| 2023 | $4,581 | $67,382 | $23,057 | $44,325 |
| 2022 | $3,688 | $47,500 | $13,471 | $34,029 |
| 2021 | $3,672 | $47,500 | $13,471 | $34,029 |
| 2020 | $3,273 | $41,670 | $13,471 | $28,199 |
| 2019 | $3,197 | $41,670 | $13,471 | $28,199 |
| 2018 | $3,071 | $36,843 | $6,825 | $30,018 |
| 2017 | $3,071 | $36,843 | $6,825 | $30,018 |
| 2016 | $3,023 | $35,920 | $7,983 | $27,937 |
| 2014 | $3,077 | $35,920 | $7,983 | $27,937 |
Source: Public Records
Map
Nearby Homes
- 14611 Gammon Rd
- 14305 Gammon Rd
- 805 E Outer Belt Rd
- 14801 Hamilton Rd
- 14002 Crawford Creek Ct
- 30304 E 138th St
- 13619 S Heritage Dr
- 13620 S Heritage Dr
- 13614 S Heritage Dr
- 30208 E 135 St
- 30304 E 135 St
- 30211 E 135 St
- 30207 E 135 St
- 30305 E 135 St
- 32201 E Outerbelt Rd
- 32205 E Outerbelt Rd
- 13608 S Heritage Dr
- 13623 S Heritage Dr
- 13605 S Heritage Dr
- TBD Heritage Farms Lot 15 N A
- 14605 Hedgecock Rd
- 14600 Hedgecock Rd
- 14510 Gammon Rd
- 29708 E Stringtown Rd
- 29906 E Stringtown Rd
- 29504 E Stringtown Rd
- 14421 Gammon Rd
- 14517 Gammon Rd
- 29807 E Stringtown Rd
- 14623 Gammon Rd
- 29509 E Stringtown Rd
- 30005 E Stringtown Rd
- 14509 Gammon Rd
- 14315 Kennedy Rd
- 14220 Gammon Rd
- 14511 Gammon Rd
- 30109 E Stringtown Rd
- 30209 E Stringtown Rd
- 14403 Gammon Rd
- 14208 Gammon Rd