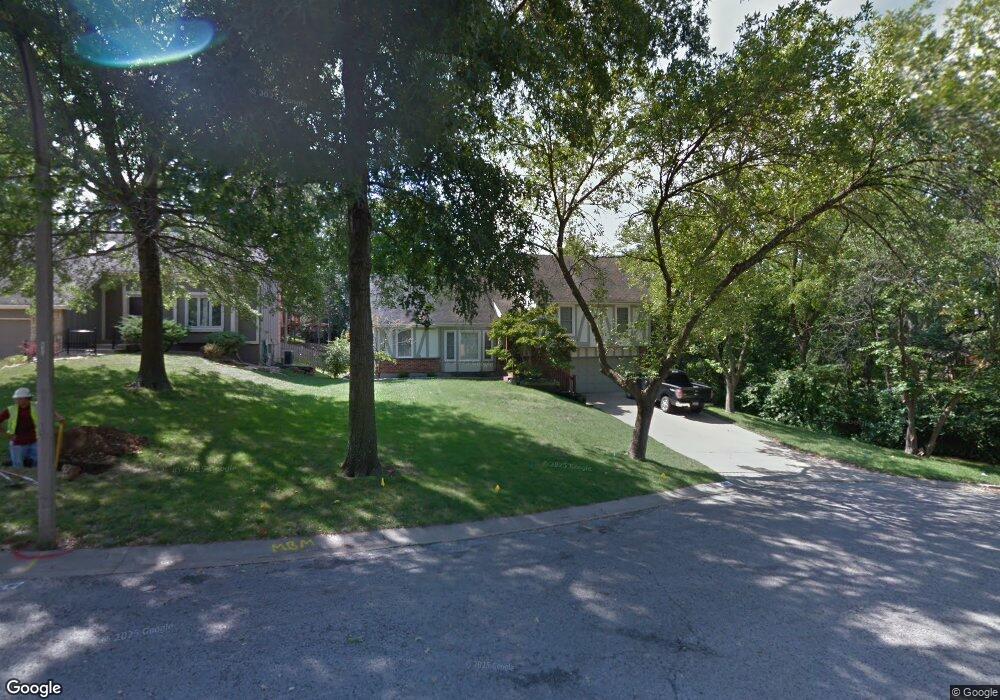
14513 W 90th Ct Lenexa, KS 66215
Estimated Value: $390,000 - $440,000
4
Beds
3
Baths
1,934
Sq Ft
$215/Sq Ft
Est. Value
About This Home
This home is located at 14513 W 90th Ct, Lenexa, KS 66215 and is currently estimated at $416,682, approximately $215 per square foot. 14513 W 90th Ct is a home located in Johnson County with nearby schools including Sunflower Elementary School, Westridge Middle School, and Shawnee Mission West High School.
Ownership History
Date
Name
Owned For
Owner Type
Purchase Details
Closed on
Oct 31, 2016
Sold by
Cummings Colin R
Bought by
Cummings Colin R and Cummings Kellie
Current Estimated Value
Home Financials for this Owner
Home Financials are based on the most recent Mortgage that was taken out on this home.
Original Mortgage
$124,500
Outstanding Balance
$53,797
Interest Rate
2.72%
Mortgage Type
New Conventional
Estimated Equity
$362,885
Purchase Details
Closed on
Oct 27, 2011
Sold by
Holy Cherry A
Bought by
Cummings Colin R
Home Financials for this Owner
Home Financials are based on the most recent Mortgage that was taken out on this home.
Original Mortgage
$136,884
Interest Rate
4.14%
Mortgage Type
New Conventional
Purchase Details
Closed on
May 25, 2004
Sold by
Freeman Robert L and Freeman Janice M
Bought by
Holy Daniel W and Holy Cherry A
Home Financials for this Owner
Home Financials are based on the most recent Mortgage that was taken out on this home.
Original Mortgage
$171,129
Interest Rate
5.97%
Mortgage Type
FHA
Create a Home Valuation Report for This Property
The Home Valuation Report is an in-depth analysis detailing your home's value as well as a comparison with similar homes in the area
Home Values in the Area
Average Home Value in this Area
Purchase History
| Date | Buyer | Sale Price | Title Company |
|---|---|---|---|
| Cummings Colin R | -- | None Available | |
| Cummings Colin R | -- | None Available | |
| Holy Daniel W | -- | Security Land Title Company |
Source: Public Records
Mortgage History
| Date | Status | Borrower | Loan Amount |
|---|---|---|---|
| Open | Cummings Colin R | $124,500 | |
| Previous Owner | Cummings Colin R | $136,884 | |
| Previous Owner | Holy Daniel W | $171,129 |
Source: Public Records
Tax History
| Year | Tax Paid | Tax Assessment Tax Assessment Total Assessment is a certain percentage of the fair market value that is determined by local assessors to be the total taxable value of land and additions on the property. | Land | Improvement |
|---|---|---|---|---|
| 2025 | $4,449 | $42,079 | $9,031 | $33,048 |
| 2024 | $4,449 | $40,273 | $7,849 | $32,424 |
| 2023 | $4,261 | $37,835 | $7,476 | $30,359 |
| 2022 | $4,014 | $35,615 | $7,116 | $28,499 |
| 2021 | $3,623 | $30,440 | $6,778 | $23,662 |
| 2020 | $3,336 | $27,715 | $6,159 | $21,556 |
| 2019 | $3,292 | $27,347 | $5,360 | $21,987 |
| 2018 | $3,273 | $26,945 | $4,876 | $22,069 |
| 2017 | $3,074 | $24,507 | $4,436 | $20,071 |
| 2016 | $2,942 | $23,150 | $4,436 | $18,714 |
| 2015 | $2,919 | $23,138 | $4,436 | $18,702 |
| 2013 | -- | $18,400 | $4,436 | $13,964 |
Source: Public Records
Map
Nearby Homes
- 14640 W 90th St
- 14900 W 91st Terrace
- 8914 Country Hill Ct
- 8645 Greenwood Ln
- 9212 Constance St
- 15113 W 91st Place
- 9412 Mullen Rd
- 8740 Park St
- 9401 Cottonwood St
- 15514 W 89th St
- 8443 Alden St
- 8362 Oakview Cir
- 8403 Swarner Dr
- 14828 W 83rd Place
- 13204 W 85th Ct
- 13212 W 84th St
- 8041 Acuff Ln
- 12908 W 84th St
- 8221 Noland Rd
- 15318 W 80th Place
- 14509 W 90th Ct
- 14506 W 90th Terrace
- 14505 W 90th Ct
- 9020 Dice Ln
- 14502 W 90th Terrace
- 14500 W 90th Ct
- 14508 W 90th Ct
- 14411 W 90th Ct
- 14416 W 90th Terrace
- 9027 Greenway Ln
- 14406 W 90th Ct
- 9024 Dice Ln
- 14412 W 90th Terrace
- 14407 W 90th Ct
- 9027 Dice Ln
- 14503 W 90th Terrace
- 14402 W 90th Ct
- 8926 Acuff Ln
- 9023 Greenway Ln
- 14417 W 90th Terrace
Your Personal Tour Guide
Ask me questions while you tour the home.