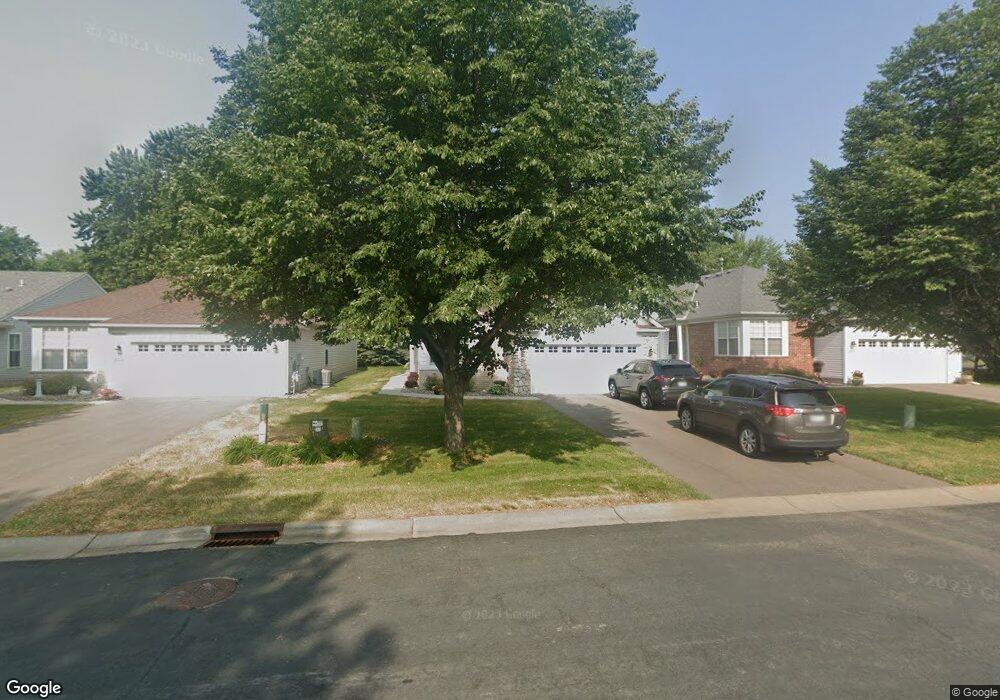
14515 Bloomfield Path Rosemount, MN 55068
Estimated Value: $476,000 - $504,000
3
Beds
3
Baths
3,244
Sq Ft
$151/Sq Ft
Est. Value
About This Home
This home is located at 14515 Bloomfield Path, Rosemount, MN 55068 and is currently estimated at $489,765, approximately $150 per square foot. 14515 Bloomfield Path is a home located in Dakota County with nearby schools including Rosemount Elementary School, Rosemount Middle School, and Rosemount Senior High School.
Ownership History
Date
Name
Owned For
Owner Type
Purchase Details
Closed on
Jun 30, 2021
Sold by
Lehman Kent R and Lehman Mary Lee
Bought by
Holte James C and Holte Brenda A
Current Estimated Value
Home Financials for this Owner
Home Financials are based on the most recent Mortgage that was taken out on this home.
Original Mortgage
$294,000
Outstanding Balance
$245,946
Interest Rate
2.9%
Mortgage Type
New Conventional
Estimated Equity
$243,819
Purchase Details
Closed on
Nov 27, 2017
Sold by
Lehman Kent R and Lehman Mary Lee
Bought by
Kent R Lehman And Mary Lee A Lehman Trus
Purchase Details
Closed on
Jul 31, 2003
Sold by
Vanbeynen John P and Vanbeynen Ingrid S
Bought by
Lehman Kent R and Lehman Mary Lee
Purchase Details
Closed on
Oct 30, 2000
Sold by
Pulte Homes Of Minnesota
Bought by
Vanbeynen John P and Vanbeynen Ingrid S
Create a Home Valuation Report for This Property
The Home Valuation Report is an in-depth analysis detailing your home's value as well as a comparison with similar homes in the area
Home Values in the Area
Average Home Value in this Area
Purchase History
| Date | Buyer | Sale Price | Title Company |
|---|---|---|---|
| Holte James C | $430,000 | Legacy Title | |
| Kent R Lehman And Mary Lee A Lehman Trus | -- | None Available | |
| Lehman Kent R | $252,900 | -- | |
| Vanbeynen John P | $179,000 | -- | |
| Holte Brenda Brenda | $430,000 | -- |
Source: Public Records
Mortgage History
| Date | Status | Borrower | Loan Amount |
|---|---|---|---|
| Open | Holte James C | $294,000 | |
| Closed | Holte Brenda Brenda | $294,000 |
Source: Public Records
Tax History
| Year | Tax Paid | Tax Assessment Tax Assessment Total Assessment is a certain percentage of the fair market value that is determined by local assessors to be the total taxable value of land and additions on the property. | Land | Improvement |
|---|---|---|---|---|
| 2024 | $5,068 | $501,200 | $73,100 | $428,100 |
| 2023 | $5,068 | $493,900 | $72,700 | $421,200 |
| 2022 | $4,062 | $458,100 | $72,400 | $385,700 |
| 2021 | $4,778 | $386,700 | $63,000 | $323,700 |
| 2020 | $4,474 | $411,200 | $63,200 | $348,000 |
| 2019 | $4,178 | $372,500 | $60,200 | $312,300 |
| 2018 | $3,844 | $364,400 | $56,300 | $308,100 |
| 2017 | $3,897 | $326,600 | $53,600 | $273,000 |
| 2016 | $3,654 | $317,400 | $52,100 | $265,300 |
| 2015 | $3,278 | $283,002 | $48,259 | $234,743 |
| 2014 | -- | $252,264 | $44,735 | $207,529 |
| 2013 | -- | $210,735 | $38,349 | $172,386 |
Source: Public Records
Map
Nearby Homes
- 2394 Beech St W
- 14373 Banyan Ln
- 2466 Beech St W
- 14648 Blueberry Ct
- 13702 Arrowhead Way
- 13842 Arrowhead Way
- 14049 Belmont Trail
- 2170 Birch St W
- 14224 Azalea Path
- 13340 Cadogan Way
- 13430 Cadogan Way
- 14955 Avondale View
- 14959 Avondale View
- 14963 Avondale View
- 14350 Atwater Way
- 14967 Avondale View
- 14971 Avondale View
- 14975 Avondale View
- 14944 Avondale View
- 14995 Avondale View
- 14523 Bloomfield Path
- 14507 Bloomfield Path
- 14531 Bloomfield Path
- 14545 Biscayne Way W
- 14535 Biscayne Way W
- 14539 Bloomfield Path
- 14555 Biscayne Way W
- 14547 Bloomfield Path
- 14514 Bloomfield Place
- 14514 Bloomfield Place Unit 244
- 14570 Bloomfield Place
- 14575 Biscayne Way W
- 14555 Bloomfield Path
- 2315 145th St W
- 14562 Bloomfield Place
- 14522 Bloomfield Place
- 14563 Bloomfield Path
- 2335 145th St W
- 14578 Bloomfield Path
- 14595 Biscayne Way W