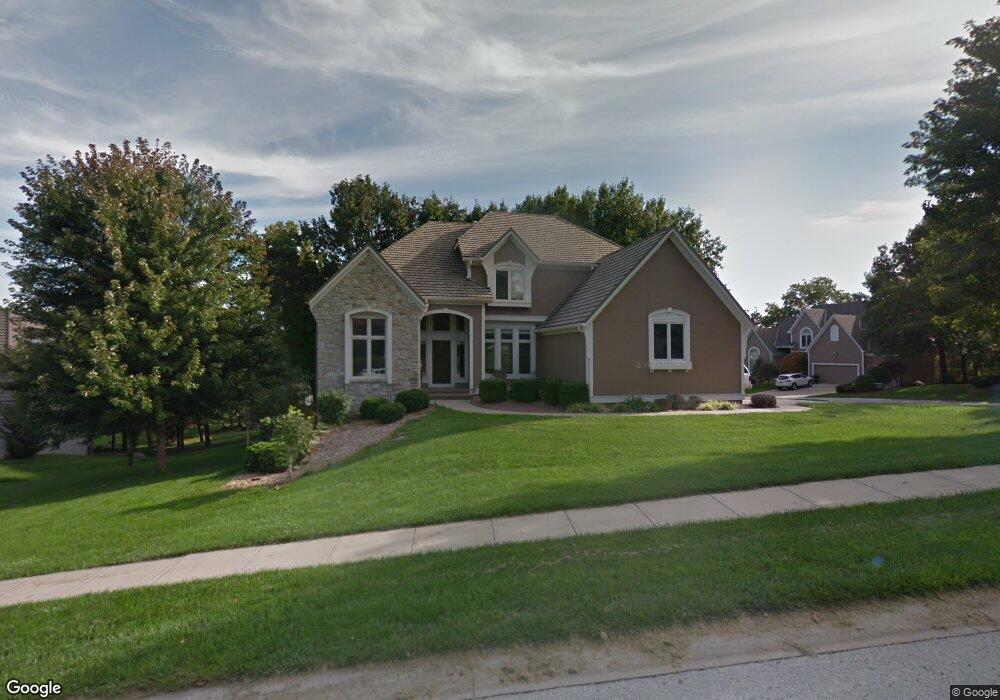
14517 W 49th St Shawnee, KS 66216
Estimated Value: $574,000 - $659,000
4
Beds
4
Baths
3,313
Sq Ft
$189/Sq Ft
Est. Value
About This Home
This home is located at 14517 W 49th St, Shawnee, KS 66216 and is currently estimated at $624,655, approximately $188 per square foot. 14517 W 49th St is a home located in Johnson County with nearby schools including Ray Marsh Elementary School, Trailridge Middle School, and Shawnee Mission Northwest High School.
Ownership History
Date
Name
Owned For
Owner Type
Purchase Details
Closed on
Jul 19, 2011
Sold by
Gustafson Craig E and Barelli Janet Sue
Bought by
Reeves Daniel C and Hamilton Reeves Jill M
Current Estimated Value
Home Financials for this Owner
Home Financials are based on the most recent Mortgage that was taken out on this home.
Original Mortgage
$337,250
Outstanding Balance
$232,237
Interest Rate
4.53%
Mortgage Type
New Conventional
Estimated Equity
$392,418
Purchase Details
Closed on
Dec 20, 2000
Sold by
Gustafson Tammy G
Bought by
Gustafson Craig E
Home Financials for this Owner
Home Financials are based on the most recent Mortgage that was taken out on this home.
Original Mortgage
$73,000
Interest Rate
5.86%
Mortgage Type
Credit Line Revolving
Create a Home Valuation Report for This Property
The Home Valuation Report is an in-depth analysis detailing your home's value as well as a comparison with similar homes in the area
Home Values in the Area
Average Home Value in this Area
Purchase History
| Date | Buyer | Sale Price | Title Company |
|---|---|---|---|
| Reeves Daniel C | -- | Chicago Title Company Llc | |
| Gustafson Craig E | $29,256 | Columbian Title Of Johnson C |
Source: Public Records
Mortgage History
| Date | Status | Borrower | Loan Amount |
|---|---|---|---|
| Open | Reeves Daniel C | $337,250 | |
| Previous Owner | Gustafson Craig E | $73,000 |
Source: Public Records
Tax History Compared to Growth
Tax History
| Year | Tax Paid | Tax Assessment Tax Assessment Total Assessment is a certain percentage of the fair market value that is determined by local assessors to be the total taxable value of land and additions on the property. | Land | Improvement |
|---|---|---|---|---|
| 2024 | $6,359 | $59,628 | $13,789 | $45,839 |
| 2023 | $5,981 | $55,683 | $11,980 | $43,703 |
| 2022 | $5,730 | $53,165 | $11,980 | $41,185 |
| 2021 | $5,730 | $48,024 | $10,886 | $37,138 |
| 2020 | $5,462 | $47,127 | $10,886 | $36,241 |
| 2019 | $5,178 | $44,643 | $9,887 | $34,756 |
| 2018 | $5,131 | $44,080 | $9,887 | $34,193 |
| 2017 | $5,317 | $44,977 | $8,983 | $35,994 |
| 2016 | $5,246 | $43,815 | $8,553 | $35,262 |
| 2015 | $4,965 | $42,826 | $8,553 | $34,273 |
| 2013 | -- | $39,641 | $8,553 | $31,088 |
Source: Public Records
Map
Nearby Homes
- 4940 Alden St
- 14210 W 50th St
- 14105 W 48th Terrace
- 13810 W 53rd St
- 5502 Mullen Rd
- 5300 Summit Ct
- 13804 W 55th Terrace
- 5530 Rene St
- 5021 Bradshaw St
- 5013 Bradshaw St
- 180 Terrace Trail S
- 5633 Oakview St
- 14170 W 49th St
- 13305 W 51st St
- 5507 Noland Rd
- 5713 Widmer Rd
- 5703 Cottonwood St
- 5826 Oakview St
- 6804 Woodend Ave
- 132 Lakeshore Dr W
- 14513 W 49th St
- 4915 Oakview St
- 14603 W 49th St
- 4835 Oakview St
- 14510 W 49th St
- 14509 W 49th St
- 14514 W 49th St
- 14520 W 50th St
- 14602 W 49th St
- 14601 W 49th Terrace
- 14607 W 49th St
- 14604 W 49th Terrace
- 14519 W 48th Terrace
- 14516 W 50th St
- 14606 W 49th St
- 14515 W 48th Terrace
- 4828 Oakview St
- 14605 W 49th Terrace
- 14608 W 49th Terrace
- 14611 W 49th St