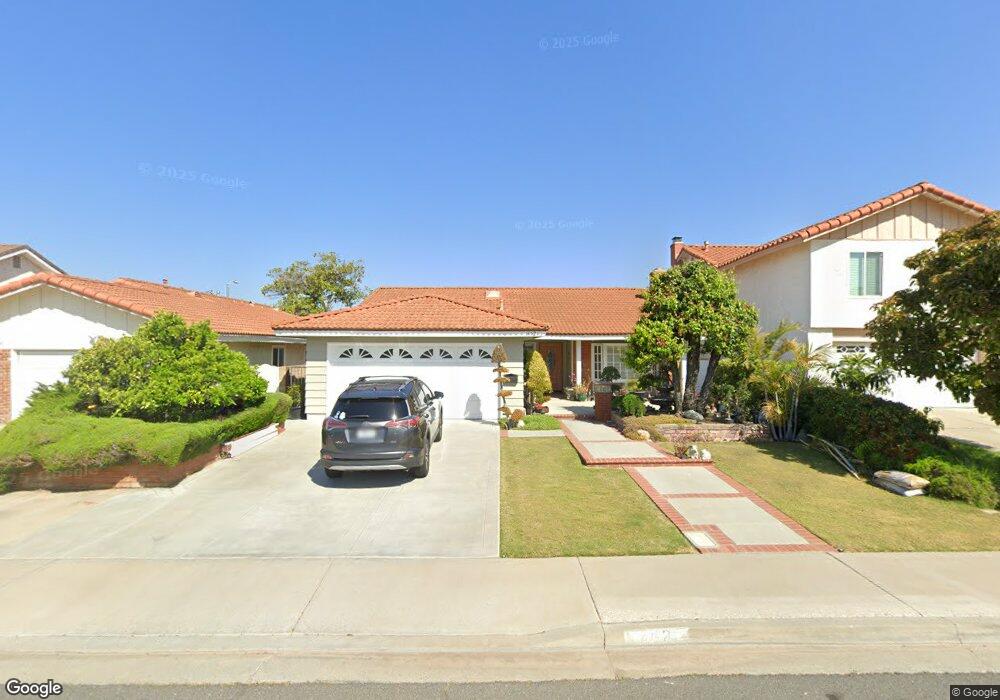
14521 Larch Ave Irvine, CA 92606
Walnut NeighborhoodEstimated Value: $1,288,000 - $1,455,000
3
Beds
2
Baths
1,420
Sq Ft
$964/Sq Ft
Est. Value
About This Home
This home is located at 14521 Larch Ave, Irvine, CA 92606 and is currently estimated at $1,368,737, approximately $963 per square foot. 14521 Larch Ave is a home located in Orange County with nearby schools including College Park Elementary School, Venado Middle School, and Irvine High School.
Ownership History
Date
Name
Owned For
Owner Type
Purchase Details
Closed on
Apr 16, 2022
Sold by
Dan Nguyen
Bought by
Dan Nguyen & Christina Nguyen Living Trust
Current Estimated Value
Purchase Details
Closed on
Jan 22, 2022
Sold by
Christina Nguyen
Bought by
Nguyen Dan and Nguyen Christina
Purchase Details
Closed on
Dec 1, 1999
Sold by
Nguyen Dan
Bought by
Nguyen Christina
Home Financials for this Owner
Home Financials are based on the most recent Mortgage that was taken out on this home.
Original Mortgage
$150,000
Interest Rate
7.95%
Purchase Details
Closed on
Nov 15, 1999
Sold by
Wai Yow Hon and Deng Ping Deng
Bought by
Nguyen Christina
Home Financials for this Owner
Home Financials are based on the most recent Mortgage that was taken out on this home.
Original Mortgage
$150,000
Interest Rate
7.95%
Create a Home Valuation Report for This Property
The Home Valuation Report is an in-depth analysis detailing your home's value as well as a comparison with similar homes in the area
Home Values in the Area
Average Home Value in this Area
Purchase History
| Date | Buyer | Sale Price | Title Company |
|---|---|---|---|
| Dan Nguyen & Christina Nguyen Living Trust | -- | Law Offices Of Anh V Pham | |
| Nguyen Dan | -- | None Listed On Document | |
| Nguyen Christina | -- | American Title Co | |
| Nguyen Christina | $259,000 | American Title Co |
Source: Public Records
Mortgage History
| Date | Status | Borrower | Loan Amount |
|---|---|---|---|
| Previous Owner | Nguyen Christina | $150,000 |
Source: Public Records
Tax History
| Year | Tax Paid | Tax Assessment Tax Assessment Total Assessment is a certain percentage of the fair market value that is determined by local assessors to be the total taxable value of land and additions on the property. | Land | Improvement |
|---|---|---|---|---|
| 2025 | $4,188 | $398,069 | $276,434 | $121,635 |
| 2024 | $4,188 | $390,264 | $271,014 | $119,250 |
| 2023 | $4,079 | $382,612 | $265,700 | $116,912 |
| 2022 | $3,996 | $375,110 | $260,490 | $114,620 |
| 2021 | $3,901 | $367,755 | $255,382 | $112,373 |
| 2020 | $3,879 | $363,985 | $252,764 | $111,221 |
| 2019 | $3,791 | $356,849 | $247,808 | $109,041 |
| 2018 | $3,722 | $349,852 | $242,949 | $106,903 |
| 2017 | $3,643 | $342,993 | $238,186 | $104,807 |
| 2016 | $3,484 | $336,268 | $233,516 | $102,752 |
| 2015 | $3,432 | $331,217 | $230,008 | $101,209 |
| 2014 | $3,365 | $324,729 | $225,502 | $99,227 |
Source: Public Records
Map
Nearby Homes
- 14541 Savin Ave
- 3761 Provincetown Ave
- 3852 Uris Ct
- 14272 Saarinen Ct
- 17 Rhode Island
- 14072 Picasso Ct
- 14172 Moore Ct
- 175 Zephyr Run Unit 175
- 424 Deerfield Ave Unit 172
- 280 Tustin Field Dr
- 24 Millstone Unit 137
- 328 Flyers Ln
- 390 Deerfield Ave Unit 125
- 369 Deerfield Ave Unit 35
- 374 Aviator Ln
- 4062 Escudero Dr
- 11 Pienza
- 4511 Charleville Cir
- 14 Wakefield
- 16626 Mosscreek St
- 14531 Larch Ave
- 14511 Larch Ave
- 14541 Larch Ave
- 14501 Larch Ave
- 14551 Larch Ave
- 14522 Larch Ave
- 14532 Larch Ave
- 14512 Larch Ave
- 14491 Larch Ave
- 14542 Larch Ave
- 14522 Linden Ave
- 14561 Larch Ave
- 14502 Larch Ave
- 14532 Linden Ave
- 14512 Linden Ave
- 14482 Larch Ave
- 14502 Linden Ave
- 14542 Linden Ave
- 14492 Larch Ave
- 14552 Linden Ave
Your Personal Tour Guide
Ask me questions while you tour the home.