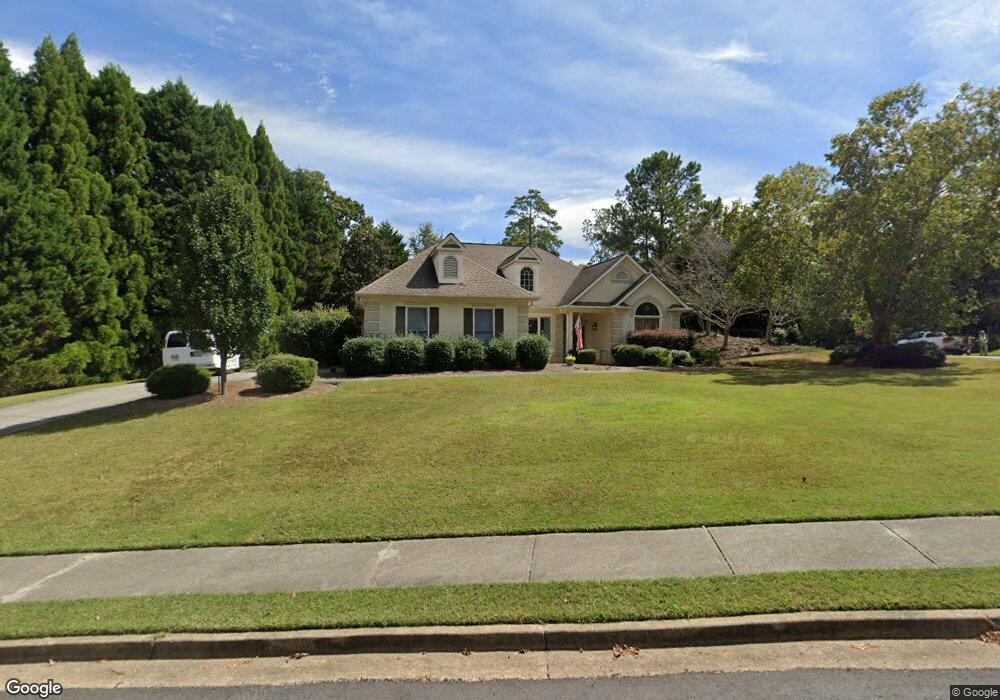
1453 Mulberry Creek Ct Dacula, GA 30019
Estimated Value: $442,000 - $466,000
3
Beds
3
Baths
2,105
Sq Ft
$215/Sq Ft
Est. Value
About This Home
This home is located at 1453 Mulberry Creek Ct, Dacula, GA 30019 and is currently estimated at $451,852, approximately $214 per square foot. 1453 Mulberry Creek Ct is a home located in Gwinnett County with nearby schools including Puckett's Mill Elementary School, Frank N. Osborne Middle School, and Mill Creek High School.
Ownership History
Date
Name
Owned For
Owner Type
Purchase Details
Closed on
Mar 21, 2007
Sold by
Jp Morgan Chase Bank
Bought by
Packard Lloyd A and Packard Diane E
Current Estimated Value
Home Financials for this Owner
Home Financials are based on the most recent Mortgage that was taken out on this home.
Original Mortgage
$260,000
Outstanding Balance
$151,094
Interest Rate
5.63%
Mortgage Type
New Conventional
Estimated Equity
$300,758
Purchase Details
Closed on
Oct 3, 2006
Sold by
Ahn Chang K
Bought by
Jp Morgan Chase Bank
Purchase Details
Closed on
Sep 10, 1999
Sold by
Waterford Homes Inc
Bought by
Vogel Sharon A and Vogel Henry
Home Financials for this Owner
Home Financials are based on the most recent Mortgage that was taken out on this home.
Original Mortgage
$175,000
Interest Rate
7.91%
Mortgage Type
New Conventional
Create a Home Valuation Report for This Property
The Home Valuation Report is an in-depth analysis detailing your home's value as well as a comparison with similar homes in the area
Home Values in the Area
Average Home Value in this Area
Purchase History
| Date | Buyer | Sale Price | Title Company |
|---|---|---|---|
| Packard Lloyd A | $226,000 | -- | |
| Jp Morgan Chase Bank | $216,000 | -- | |
| Vogel Sharon A | $220,900 | -- |
Source: Public Records
Mortgage History
| Date | Status | Borrower | Loan Amount |
|---|---|---|---|
| Open | Packard Lloyd A | $260,000 | |
| Previous Owner | Vogel Sharon A | $175,000 |
Source: Public Records
Tax History Compared to Growth
Tax History
| Year | Tax Paid | Tax Assessment Tax Assessment Total Assessment is a certain percentage of the fair market value that is determined by local assessors to be the total taxable value of land and additions on the property. | Land | Improvement |
|---|---|---|---|---|
| 2025 | $1,569 | $176,520 | $59,840 | $116,680 |
| 2024 | $1,594 | $166,200 | $45,600 | $120,600 |
| 2023 | $1,594 | $152,880 | $45,600 | $107,280 |
| 2022 | $1,553 | $135,840 | $40,400 | $95,440 |
| 2021 | $1,535 | $101,520 | $27,200 | $74,320 |
| 2020 | $1,533 | $101,520 | $27,200 | $74,320 |
| 2019 | $1,412 | $101,520 | $27,200 | $74,320 |
| 2018 | $1,394 | $95,000 | $27,200 | $67,800 |
| 2016 | $3,546 | $89,520 | $24,000 | $65,520 |
| 2015 | $3,307 | $81,800 | $22,800 | $59,000 |
| 2014 | -- | $81,800 | $22,800 | $59,000 |
Source: Public Records
Map
Nearby Homes
- 1495 Mill Place Dr
- 1470 Highland Forge Ct
- 3304 Brooksong Way Unit 2
- 1668 Mulberry Lake Dr
- 1751 Mulberry Lake Dr
- 1843 Hamilton Mill Pkwy
- 1671 Mulberry Lake Dr
- 170 Ewing Way
- 1 Ewing Way
- 255 Old Town Rd
- 3177 Hog Mountain Rd
- 2636 Grove Valley Ln
- 3763 Terrace Hedge Ct
- 1775 Lake Heights Cir
- 3411 Jim Moore Rd
- 969 Hilltop Park Ct
- 1264 Six Sisters St
- 1463 Mulberry Creek Ct
- 0 Mulberry Creek Ct Unit 7077828
- 0 Mulberry Creek Ct Unit 8691450
- 1456 Mulberry Creek Ct
- 3443 Mill Grove Terrace
- 1473 Mulberry Creek Ct
- 3433 Mill Grove Terrace
- 1490 Mill Place Dr
- 1500 Mill Place Dr
- 1466 Mulberry Creek Ct
- 3423 Mill Grove Terrace
- 1480 Mill Place Dr
- 1483 Mulberry Creek Ct
- 3404 Mill Grove Terrace
- 1476 Mulberry Creek Ct
- 3413 Mill Grove Terrace
- 1510 Mill Place Dr
- 3448 Highland Forge Trail
- 1470 Mill Place Dr
- 3438 Highland Forge Trail