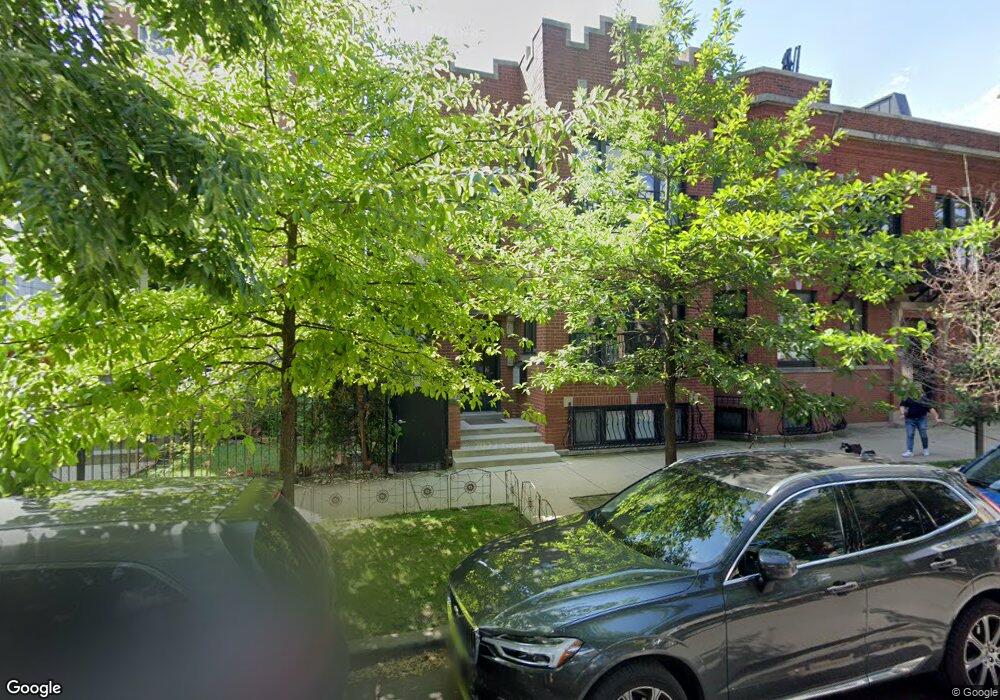
1453 W Fletcher St Unit 14532 Chicago, IL 60657
Southport Corridor NeighborhoodEstimated Value: $545,032 - $832,000
3
Beds
2
Baths
2,100
Sq Ft
$342/Sq Ft
Est. Value
About This Home
This home is located at 1453 W Fletcher St Unit 14532, Chicago, IL 60657 and is currently estimated at $717,758, approximately $341 per square foot. 1453 W Fletcher St Unit 14532 is a home located in Cook County with nearby schools including Augustus H. Burley Elementary School, Lake View High School, and Saint Luke Academy.
Ownership History
Date
Name
Owned For
Owner Type
Purchase Details
Closed on
Jul 26, 2016
Sold by
Bossons Shaun and Bossons Terri
Bought by
Holzman Declan
Current Estimated Value
Home Financials for this Owner
Home Financials are based on the most recent Mortgage that was taken out on this home.
Original Mortgage
$417,100
Outstanding Balance
$332,797
Interest Rate
3.48%
Mortgage Type
New Conventional
Estimated Equity
$384,961
Purchase Details
Closed on
Mar 27, 2008
Sold by
Domus On Fletcher Llc
Bought by
Bossons Shaun
Home Financials for this Owner
Home Financials are based on the most recent Mortgage that was taken out on this home.
Original Mortgage
$466,650
Interest Rate
6.12%
Mortgage Type
Unknown
Purchase Details
Closed on
Oct 11, 2007
Sold by
Jaworowski Christopher and Jaworowski Agata
Bought by
Domus On Fletcher Llc
Purchase Details
Closed on
May 25, 2005
Sold by
Haderlein Gerard D
Bought by
Smith Dorothy A
Create a Home Valuation Report for This Property
The Home Valuation Report is an in-depth analysis detailing your home's value as well as a comparison with similar homes in the area
Home Values in the Area
Average Home Value in this Area
Purchase History
| Date | Buyer | Sale Price | Title Company |
|---|---|---|---|
| Holzman Declan | $515,000 | Attorney | |
| Bossons Shaun | $518,500 | Saturn Title Llc | |
| Domus On Fletcher Llc | -- | None Available | |
| Smith Dorothy A | $600,000 | Cti |
Source: Public Records
Mortgage History
| Date | Status | Borrower | Loan Amount |
|---|---|---|---|
| Open | Holzman Declan | $417,100 | |
| Previous Owner | Bossons Shaun | $466,650 |
Source: Public Records
Tax History Compared to Growth
Tax History
| Year | Tax Paid | Tax Assessment Tax Assessment Total Assessment is a certain percentage of the fair market value that is determined by local assessors to be the total taxable value of land and additions on the property. | Land | Improvement |
|---|---|---|---|---|
| 2024 | $6,858 | $41,014 | $17,792 | $23,222 |
| 2023 | $6,664 | $35,819 | $14,348 | $21,471 |
| 2022 | $6,664 | $35,819 | $14,348 | $21,471 |
| 2021 | $6,533 | $35,818 | $14,348 | $21,470 |
| 2020 | $6,898 | $34,068 | $5,739 | $28,329 |
| 2019 | $7,464 | $37,152 | $5,739 | $31,413 |
| 2018 | $7,339 | $37,152 | $5,739 | $31,413 |
| 2017 | $6,594 | $30,630 | $5,165 | $25,465 |
| 2016 | $6,135 | $30,630 | $5,165 | $25,465 |
| 2015 | $5,613 | $30,630 | $5,165 | $25,465 |
| 2014 | $6,387 | $34,424 | $4,208 | $30,216 |
| 2013 | $6,261 | $34,424 | $4,208 | $30,216 |
Source: Public Records
Map
Nearby Homes
- 1437 W Belmont Ave Unit 4
- 1425 W Belmont Ave Unit 3
- 3059 N Lincoln Ave Unit B
- 1442 W Belmont Ave Unit 2E
- 3505 N Greenview Ave
- 3160 N Lincoln Ave Unit 310
- 3037 N Lincoln Ave Unit 303
- 3037 N Lincoln Ave Unit 301
- 3037 N Lincoln Ave Unit PH-05
- 3037 N Lincoln Ave Unit 304
- 3037 N Lincoln Ave Unit 203
- 3037 N Lincoln Ave Unit 201
- 3037 N Lincoln Ave Unit 302
- 3037 N Lincoln Ave Unit PH-04
- 3037 N Lincoln Ave Unit PH-01
- 1342 W Belmont Ave Unit 3E
- 3015 N Southport Ave Unit 2W
- 3015 N Southport Ave Unit 3W
- 3015 N Southport Ave Unit PH
- 3015 N Southport Ave Unit 4W
- 1453 W Fletcher St Unit 14531
- 1453 W Fletcher St Unit 1
- 1453 W Fletcher St Unit 2
- 1455 W Fletcher St Unit 14552
- 1455 W Fletcher St Unit 14551
- 1455 W Fletcher St Unit 2
- 1455 W Fletcher St Unit 1
- 1449 W Fletcher St Unit 3
- 1457 W Fletcher St Unit 14572
- 1457 W Fletcher St Unit 14571
- 1457 W Fletcher St Unit 1
- 1457 W Fletcher St Unit 2
- 1447 W Fletcher St
- 1445 W Fletcher St
- 1443 W Fletcher St
- 1443 W Fletcher St Unit 1
- 1441 W Fletcher St Unit CH
- 1441 W Fletcher St
- 1441 W Fletcher St Unit 1
- 3113 N Greenview Ave Unit 3113