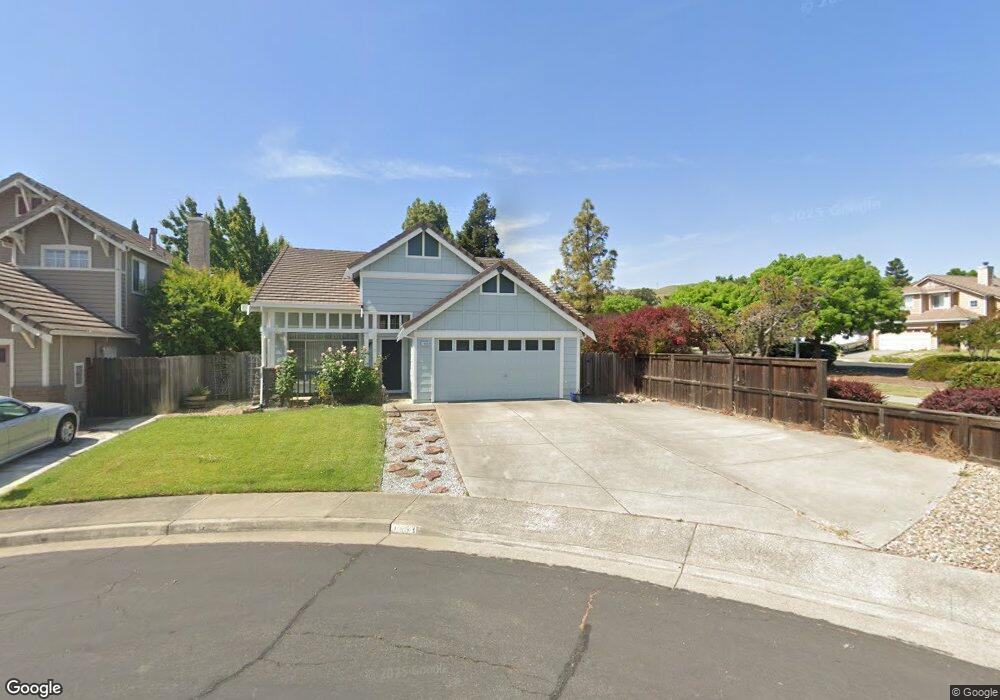
1453 Wedgewood Ct Fairfield, CA 94534
Estimated Value: $604,986 - $641,000
3
Beds
2
Baths
1,485
Sq Ft
$421/Sq Ft
Est. Value
About This Home
This home is located at 1453 Wedgewood Ct, Fairfield, CA 94534 and is currently estimated at $625,247, approximately $421 per square foot. 1453 Wedgewood Ct is a home located in Solano County with nearby schools including Cordelia Hills Elementary School, Green Valley Middle School, and Angelo Rodriguez High School.
Ownership History
Date
Name
Owned For
Owner Type
Purchase Details
Closed on
Apr 24, 2015
Sold by
Schleich Kaye L
Bought by
Schleich Kaye L
Current Estimated Value
Purchase Details
Closed on
Oct 15, 2001
Sold by
Blasco Mark A and Blasco Tia D
Bought by
Schleich Kaye L
Home Financials for this Owner
Home Financials are based on the most recent Mortgage that was taken out on this home.
Original Mortgage
$202,400
Outstanding Balance
$79,169
Interest Rate
6.88%
Estimated Equity
$546,078
Purchase Details
Closed on
Apr 1, 1998
Sold by
Fuller Donald S and Fuller Debbie R
Bought by
Blasco Mark A and Blasco Tia D
Home Financials for this Owner
Home Financials are based on the most recent Mortgage that was taken out on this home.
Original Mortgage
$156,060
Interest Rate
7%
Mortgage Type
VA
Create a Home Valuation Report for This Property
The Home Valuation Report is an in-depth analysis detailing your home's value as well as a comparison with similar homes in the area
Home Values in the Area
Average Home Value in this Area
Purchase History
| Date | Buyer | Sale Price | Title Company |
|---|---|---|---|
| Schleich Kaye L | -- | None Available | |
| Schleich Kaye L | $253,000 | Frontier Title Company | |
| Blasco Mark A | $153,000 | First American Title Guarant |
Source: Public Records
Mortgage History
| Date | Status | Borrower | Loan Amount |
|---|---|---|---|
| Open | Schleich Kaye L | $202,400 | |
| Previous Owner | Blasco Mark A | $156,060 | |
| Closed | Schleich Kaye L | $25,300 |
Source: Public Records
Tax History Compared to Growth
Tax History
| Year | Tax Paid | Tax Assessment Tax Assessment Total Assessment is a certain percentage of the fair market value that is determined by local assessors to be the total taxable value of land and additions on the property. | Land | Improvement |
|---|---|---|---|---|
| 2025 | $4,492 | $373,746 | $140,338 | $233,408 |
| 2024 | $4,492 | $366,419 | $137,587 | $228,832 |
| 2023 | $4,343 | $359,236 | $134,890 | $224,346 |
| 2022 | $4,284 | $352,194 | $132,246 | $219,948 |
| 2021 | $4,225 | $345,289 | $129,653 | $215,636 |
| 2020 | $4,301 | $341,749 | $128,324 | $213,425 |
| 2019 | $4,178 | $335,049 | $125,808 | $209,241 |
| 2018 | $4,300 | $328,481 | $123,342 | $205,139 |
| 2017 | $4,254 | $322,041 | $120,924 | $201,117 |
| 2016 | $4,226 | $315,727 | $118,553 | $197,174 |
| 2015 | $3,980 | $310,986 | $116,773 | $194,213 |
| 2014 | $3,949 | $304,895 | $114,486 | $190,409 |
Source: Public Records
Map
Nearby Homes
- 1678 Autumnwood Ct
- 4732 Opus Cir
- 1756 Fawn Glen Cir
- 824 Crescendo St
- 840 Crescendo St
- 848 Crescendo St
- The Dulcian Plan at Cadence at Gold Hill
- The Adagio Plan at Cadence at Gold Hill
- The Cornet Plan at Cadence at Gold Hill
- The Entrata Plan at Cadence at Gold Hill
- The Bolero Plan at Cadence at Gold Hill
- 5001 Lakeview Cir
- 4927 Claremont Ct
- 4881 Regency Place
- 1946 Leaning Oak Ct
- 2197 Yellow Rose Cir
- 828 Stoneridge Cir
- 1813 Holsteiner Dr
- 680 Silver Lake Dr
- 4933 Brittany Dr
- 1457 Wedgewood Ct
- 1461 Wedgewood Ct
- 1454 Stonewood Ct
- 1458 Stonewood Ct
- 1465 Wedgewood Ct
- 1462 Stonewood Ct
- 1452 Wedgewood Ct
- 1432 Driftwood Cir
- 1456 Wedgewood Ct
- 1426 Driftwood Cir
- 1438 Driftwood Cir
- 4762 Stonewood Dr
- 1460 Wedgewood Ct
- 1420 Driftwood Cir
- 4758 Stonewood Dr
- 4766 Stonewood Dr
- 1444 Driftwood Cir
- 4770 Stonewood Dr
- 4754 Stonewood Dr
- 1464 Wedgewood Ct