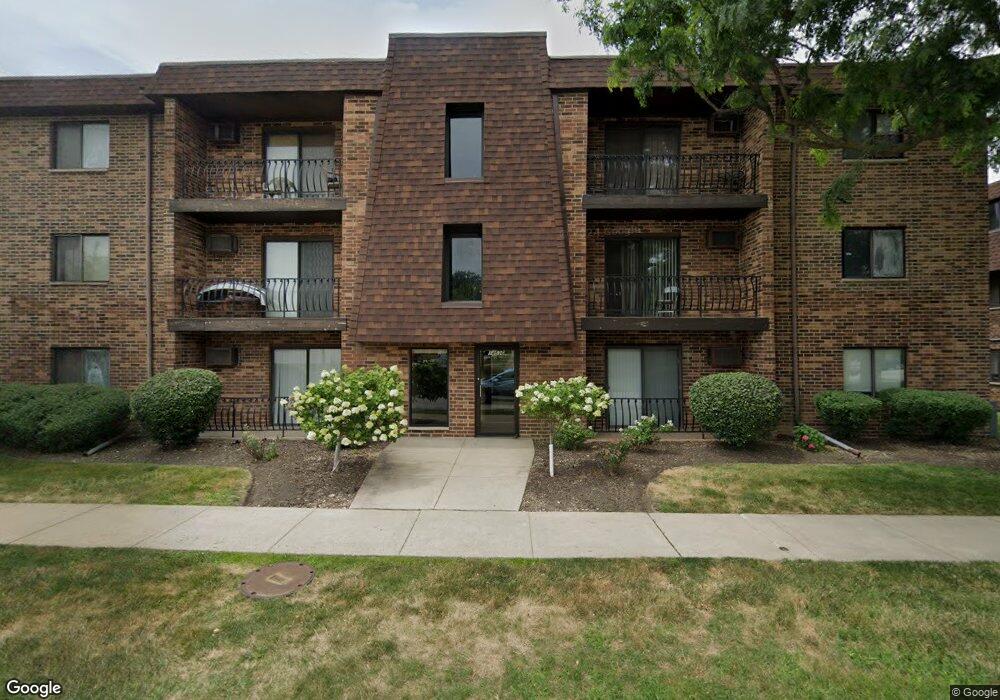
14536 S Muskegon Ave Unit 14536 Chicago, IL 60633
Estimated Value: $73,000 - $89,000
2
Beds
1
Bath
900
Sq Ft
$90/Sq Ft
Est. Value
About This Home
This home is located at 14536 S Muskegon Ave Unit 14536, Chicago, IL 60633 and is currently estimated at $80,569, approximately $89 per square foot. 14536 S Muskegon Ave Unit 14536 is a home located in Cook County with nearby schools including Wilson Elementary School, Wentworth Intermediate School, and Wentworth Jr High School.
Ownership History
Date
Name
Owned For
Owner Type
Purchase Details
Closed on
Jul 29, 2015
Sold by
U S Bank Trust National Association
Bought by
Powell Mary E
Current Estimated Value
Purchase Details
Closed on
Sep 4, 2014
Sold by
Burrows Sylvia
Bought by
U S Bank Trust National Associaion
Purchase Details
Closed on
Mar 31, 2004
Sold by
Chicago Title Land Trust Co
Bought by
Burrows Sylvia M
Home Financials for this Owner
Home Financials are based on the most recent Mortgage that was taken out on this home.
Original Mortgage
$65,475
Interest Rate
5.99%
Mortgage Type
FHA
Purchase Details
Closed on
Jul 6, 2001
Sold by
Kielbasinski Daniel S
Bought by
Fifth Third Bank and Trust #16972
Purchase Details
Closed on
Jul 27, 1995
Sold by
Kielbasinski Loretta C
Bought by
Kielbasinski Loretta C and Kielbasinski Daniel S
Create a Home Valuation Report for This Property
The Home Valuation Report is an in-depth analysis detailing your home's value as well as a comparison with similar homes in the area
Home Values in the Area
Average Home Value in this Area
Purchase History
| Date | Buyer | Sale Price | Title Company |
|---|---|---|---|
| Powell Mary E | $20,000 | Chicago Title Insurance Co | |
| U S Bank Trust National Associaion | -- | None Available | |
| Burrows Sylvia M | $67,500 | Ticor Title | |
| Fifth Third Bank | -- | -- | |
| Kielbasinski Loretta C | -- | -- |
Source: Public Records
Mortgage History
| Date | Status | Borrower | Loan Amount |
|---|---|---|---|
| Previous Owner | Burrows Sylvia M | $65,475 |
Source: Public Records
Tax History Compared to Growth
Tax History
| Year | Tax Paid | Tax Assessment Tax Assessment Total Assessment is a certain percentage of the fair market value that is determined by local assessors to be the total taxable value of land and additions on the property. | Land | Improvement |
|---|---|---|---|---|
| 2024 | $1,874 | $6,291 | $559 | $5,732 |
| 2023 | -- | $6,291 | $559 | $5,732 |
| 2022 | $0 | $2,283 | $621 | $1,662 |
| 2021 | $16 | $2,282 | $620 | $1,662 |
| 2020 | $16 | $2,282 | $620 | $1,662 |
| 2019 | $1,894 | $2,583 | $558 | $2,025 |
| 2018 | $0 | $3,399 | $558 | $2,841 |
| 2017 | $16 | $3,399 | $558 | $2,841 |
| 2016 | $2,033 | $5,778 | $496 | $5,282 |
| 2015 | $1,868 | $5,778 | $496 | $5,282 |
| 2014 | $2,062 | $5,778 | $496 | $5,282 |
| 2013 | $972 | $4,533 | $496 | $4,037 |
Source: Public Records
Map
Nearby Homes
- 14541 S Marquette Ave
- 2605 E Martha Place
- 289 Saginaw Ave
- 327 Marquette Ave
- 341 Saginaw Ave
- 281 Hoxie Ave
- 1074 George St
- 2736 E Goodrich Ave
- 14240 S Manistee Ave
- 286 Calhoun Ave
- 318 Campbell Ave
- 14241 S Marquette Ave
- 14322 S Hoxie Ave
- 412 Saginaw Ave
- 383 Calhoun Ave
- 1155 Harding Ave
- 430 Marquette Ave
- 349 Yates Ave
- 1613 Astor St Unit 1W
- 1613 Astor St Unit 16131E
- 14536 S Muskegon Ave Unit 2C
- 14536 S Muskegon Ave Unit 14536
- 14536 S Muskegon Ave Unit 14536
- 14536 S Muskegon Ave Unit 14536
- 14536 S Muskegon Ave Unit 14536
- 14536 S Muskegon Ave Unit 14536
- 14536 S Muskegon Ave Unit 14536
- 14536 S Muskegon Ave Unit 14536
- 14536 S Muskegon Ave Unit 14536
- 14536 S Muskegon Ave Unit 14536
- 14536 S Muskegon Ave Unit 14536
- 14536 S Muskegon Ave Unit 1D
- 14536 S Muskegon Ave Unit 2D
- 14536 S Muskegon Ave Unit 2A
- 14536 S Muskegon Ave Unit 1B
- 14526 S Muskegon Ave Unit 14526
- 14526 S Muskegon Ave Unit 14526
- 14526 S Muskegon Ave Unit 14526
- 14526 S Muskegon Ave Unit 14526
- 14526 S Muskegon Ave Unit 14526