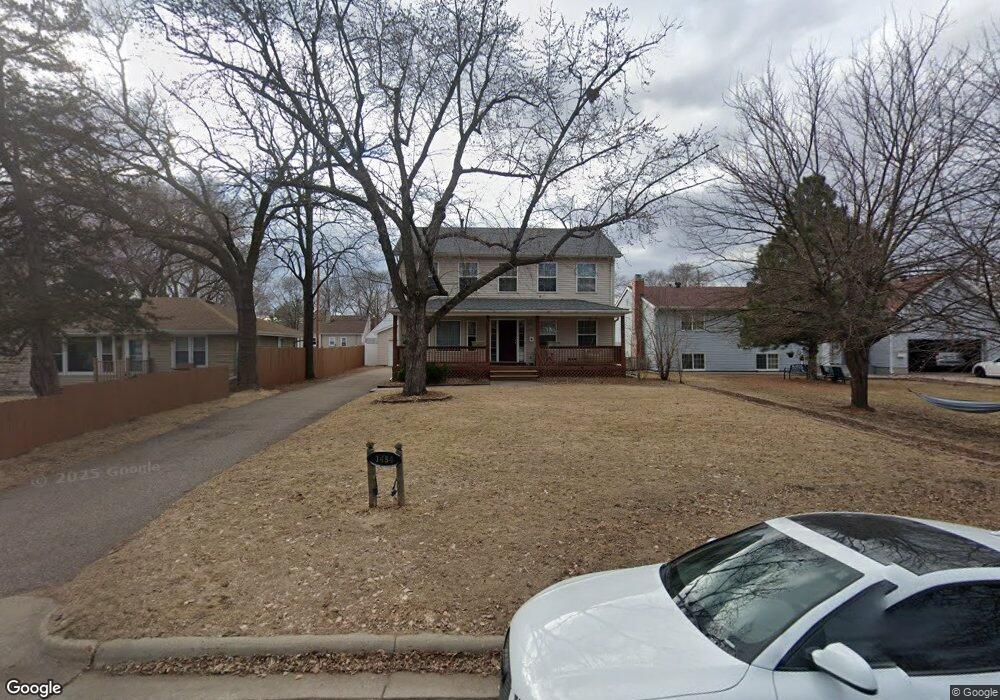
1454 1454 Jersey Ave S St. Louis Park, MN 55426
Eliot NeighborhoodEstimated Value: $574,000 - $615,000
3
Beds
4
Baths
1,920
Sq Ft
$308/Sq Ft
Est. Value
About This Home
This home is located at 1454 1454 Jersey Ave S, St. Louis Park, MN 55426 and is currently estimated at $591,465, approximately $308 per square foot. 1454 1454 Jersey Ave S is a home located in Hennepin County with nearby schools including Peter Hobart Elementary School, St. Louis Park Middle School, and St. Louis Park High School.
Ownership History
Date
Name
Owned For
Owner Type
Purchase Details
Closed on
Feb 28, 2019
Sold by
Bubb Steve and Bubb Tara
Bought by
Alter Zachary Aaron and Kellogg Elizabeth Rose
Current Estimated Value
Home Financials for this Owner
Home Financials are based on the most recent Mortgage that was taken out on this home.
Original Mortgage
$382,500
Outstanding Balance
$336,283
Interest Rate
4.4%
Mortgage Type
New Conventional
Estimated Equity
$255,182
Purchase Details
Closed on
Aug 31, 2010
Sold by
Bubb Larry M
Bought by
Bubb Tara and Bubb Steve
Purchase Details
Closed on
Aug 6, 2004
Sold by
Tack Timothy F
Bought by
Kassab Hamdy A
Purchase Details
Closed on
Jan 15, 2001
Sold by
Al Stobbe Homes Inc
Bought by
Burkard Scott R and Tack Timothy F
Purchase Details
Closed on
Jun 28, 1999
Sold by
Knoke Franklin H
Bought by
Housing Authority Of St Louis Park
Create a Home Valuation Report for This Property
The Home Valuation Report is an in-depth analysis detailing your home's value as well as a comparison with similar homes in the area
Home Values in the Area
Average Home Value in this Area
Purchase History
| Date | Buyer | Sale Price | Title Company |
|---|---|---|---|
| Alter Zachary Aaron | $450,000 | Dca Title | |
| Bubb Tara | $225,000 | -- | |
| Kassab Hamdy A | $355,000 | -- | |
| Burkard Scott R | $227,500 | -- | |
| Housing Authority Of St Louis Park | $35,000 | -- |
Source: Public Records
Mortgage History
| Date | Status | Borrower | Loan Amount |
|---|---|---|---|
| Open | Alter Zachary Aaron | $382,500 |
Source: Public Records
Tax History Compared to Growth
Tax History
| Year | Tax Paid | Tax Assessment Tax Assessment Total Assessment is a certain percentage of the fair market value that is determined by local assessors to be the total taxable value of land and additions on the property. | Land | Improvement |
|---|---|---|---|---|
| 2024 | $7,721 | $541,500 | $142,100 | $399,400 |
| 2023 | $6,844 | $511,800 | $142,100 | $369,700 |
| 2022 | $6,486 | $522,500 | $141,400 | $381,100 |
| 2021 | $5,904 | $486,000 | $123,000 | $363,000 |
| 2020 | $5,663 | $447,200 | $117,200 | $330,000 |
| 2019 | $5,659 | $411,700 | $111,700 | $300,000 |
| 2018 | $5,541 | $398,100 | $106,400 | $291,700 |
| 2017 | $5,121 | $362,100 | $84,200 | $277,900 |
| 2016 | $5,012 | $343,100 | $76,000 | $267,100 |
| 2015 | $5,162 | $343,100 | $71,100 | $272,000 |
| 2014 | -- | $313,600 | $67,500 | $246,100 |
Source: Public Records
Map
Nearby Homes
- 1464 Idaho Ave S
- 1417 Jersey Ave S
- 1409 Nevada Ave S
- 2016 Kentucky Ave S
- 1611 Oregon Ave S
- 1605 Pennsylvania Ave S
- 1836 Dakota Ave S
- 2054 Louisiana Ave S
- 1817 Dakota Ave S
- 7414 W 22nd St Unit 114
- 7414 W 22nd St Unit 212
- 6506 Eliot View Rd
- 7009 Cedar Lake Rd S
- 1660 Blackstone Ave
- 1550 Zarthan Ave S Unit 506
- 1530 Zarthan Ave S Unit 302
- 1350 Westwood Hills Rd
- 6926 W 24th St
- 6821 W 24th St
- 380 Laurel Curve
- 1461 1461 Jersey Ave S
- 1451 1451 Jersey Ave S
- 1460 1460 Jersey Ave S
- 1457 Jersey Ave S
- 1454 Jersey Ave S
- 1461 Jersey Ave S
- 1465 Jersey Ave S
- 1451 Jersey Ave S
- 1460 Jersey Ave S
- 1465 Jersey Ave S
- 1446 Jersey Ave S
- 1445 Jersey Ave S
- 1469 Jersey Ave S
- 1441 Jersey Ave S
- 1441 Jersey Ave S
- 1440 Jersey Ave S
- 1470 Jersey Ave S
- 1437 Jersey Ave S
- 1477 Jersey Ave S
- 1432 1432 Jersey Ave S