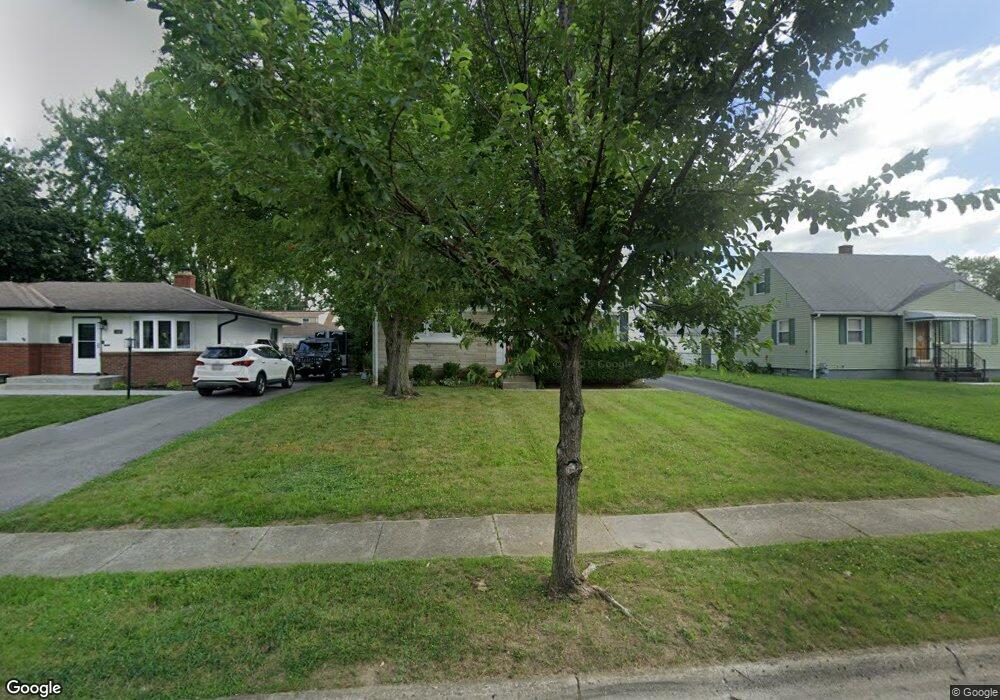
1454 Matthias Dr Columbus, OH 43224
Clinton Estates NeighborhoodEstimated Value: $287,758 - $334,000
4
Beds
2
Baths
1,678
Sq Ft
$180/Sq Ft
Est. Value
About This Home
This home is located at 1454 Matthias Dr, Columbus, OH 43224 and is currently estimated at $302,190, approximately $180 per square foot. 1454 Matthias Dr is a home located in Franklin County with nearby schools including Maize Road Elementary School, Medina Middle School, and Mifflin High School.
Ownership History
Date
Name
Owned For
Owner Type
Purchase Details
Closed on
Jul 7, 2006
Sold by
Tallarico Katrina S and Tallarico John P
Bought by
Jjk Investment Properties Ltd
Current Estimated Value
Home Financials for this Owner
Home Financials are based on the most recent Mortgage that was taken out on this home.
Original Mortgage
$81,900
Outstanding Balance
$48,285
Interest Rate
6.62%
Mortgage Type
Fannie Mae Freddie Mac
Estimated Equity
$253,905
Purchase Details
Closed on
May 31, 2006
Sold by
Erpenbeck Jennifer
Bought by
Tallarico John P and Tallarico Katrina S
Home Financials for this Owner
Home Financials are based on the most recent Mortgage that was taken out on this home.
Original Mortgage
$81,900
Outstanding Balance
$48,285
Interest Rate
6.62%
Mortgage Type
Fannie Mae Freddie Mac
Estimated Equity
$253,905
Purchase Details
Closed on
Apr 11, 2005
Sold by
Estate Of James E Mcgraner
Bought by
Erpenbeck Jennifer
Create a Home Valuation Report for This Property
The Home Valuation Report is an in-depth analysis detailing your home's value as well as a comparison with similar homes in the area
Home Values in the Area
Average Home Value in this Area
Purchase History
| Date | Buyer | Sale Price | Title Company |
|---|---|---|---|
| Jjk Investment Properties Ltd | -- | None Available | |
| Tallarico John P | $91,000 | None Available | |
| Erpenbeck Jennifer | -- | -- |
Source: Public Records
Mortgage History
| Date | Status | Borrower | Loan Amount |
|---|---|---|---|
| Open | Tallarico John P | $81,900 |
Source: Public Records
Tax History Compared to Growth
Tax History
| Year | Tax Paid | Tax Assessment Tax Assessment Total Assessment is a certain percentage of the fair market value that is determined by local assessors to be the total taxable value of land and additions on the property. | Land | Improvement |
|---|---|---|---|---|
| 2024 | $3,660 | $79,870 | $19,250 | $60,620 |
| 2023 | $3,615 | $79,870 | $19,250 | $60,620 |
| 2022 | $3,842 | $48,170 | $7,880 | $40,290 |
| 2021 | $2,564 | $48,170 | $7,880 | $40,290 |
| 2020 | $2,568 | $48,170 | $7,880 | $40,290 |
| 2019 | $2,449 | $39,380 | $6,300 | $33,080 |
| 2018 | $2,390 | $39,380 | $6,300 | $33,080 |
| 2017 | $2,507 | $39,380 | $6,300 | $33,080 |
| 2016 | $2,566 | $37,770 | $6,160 | $31,610 |
| 2015 | $2,336 | $37,770 | $6,160 | $31,610 |
| 2014 | $2,342 | $37,770 | $6,160 | $31,610 |
| 2013 | $1,216 | $39,760 | $6,475 | $33,285 |
Source: Public Records
Map
Nearby Homes
- 4143 Karl Rd Unit 314
- 4145 Karl Rd Unit 223
- 4119 Karl Rd Unit 108
- 4455 Kenfield Rd
- 1191 Bryson Rd
- 3967 Karl Rd Unit 125
- 3965 Karl Rd Unit 208
- 4057 Estates Place
- 3941 Karl Rd Unit 326
- 3939 Karl Rd Unit 108
- 1266 Pershing Dr
- 1130 Carbone Dr
- 1440 E Cooke Rd
- 4441 Wetmore Rd E
- 1734 Ferris Rd
- 1064 Hillsdale Dr
- 1496 E Cooke Rd
- 4761 Colonel Perry Dr
- 4791 Bourke Rd
- 1071 Loring Rd
- 1462 Matthias Dr
- 1461 Shanley Dr
- 1470 Matthias Dr
- 1438 Matthias Dr
- 1469 Shanley Dr
- 1451 Shanley Dr
- 1477 Shanley Dr
- 1443 Matthias Dr
- 1478 Matthias Dr
- 1430 Matthias Dr
- 1445 Shanley Dr
- 1469 Matthias Dr
- 1437 Matthias Dr
- 1486 Matthias Dr
- 1420 Matthias Dr
- 1477 Matthias Dr
- 1429 Matthias Dr
- 1437 Shanley Dr
- 1491 Shanley Dr
- 1464 Shanley Dr