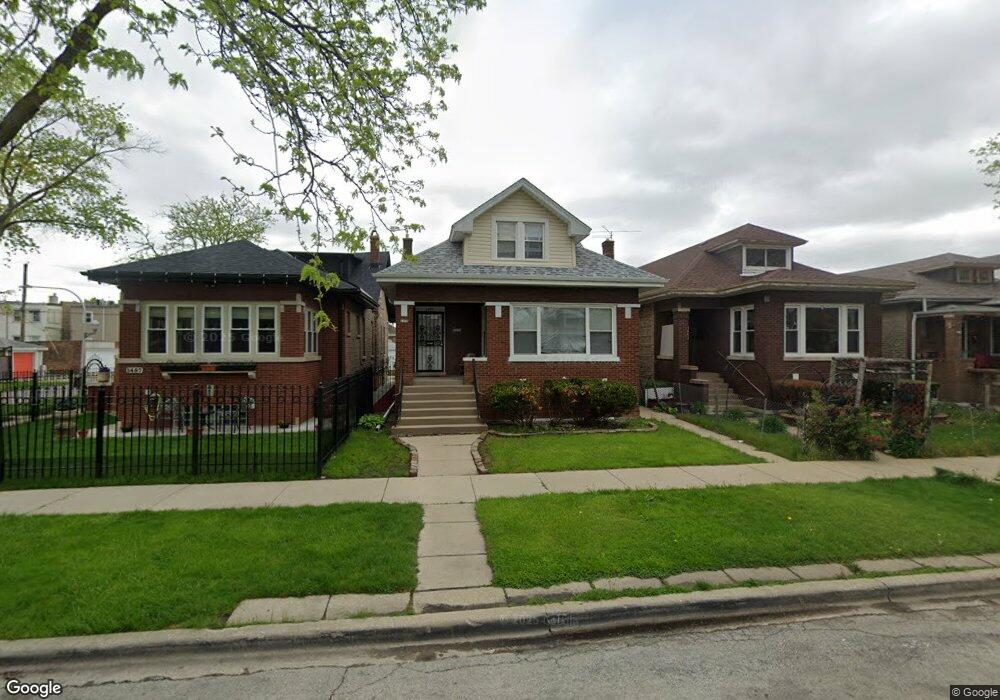
1455 N Mason Ave Chicago, IL 60651
Austin NeighborhoodEstimated Value: $281,000 - $416,000
5
Beds
3
Baths
1,244
Sq Ft
$274/Sq Ft
Est. Value
About This Home
This home is located at 1455 N Mason Ave, Chicago, IL 60651 and is currently estimated at $340,858, approximately $274 per square foot. 1455 N Mason Ave is a home located in Cook County with nearby schools including Ella Flagg Young School, CICS West Belden, and St Angela Elementary School.
Ownership History
Date
Name
Owned For
Owner Type
Purchase Details
Closed on
Feb 5, 2010
Sold by
K Future Builders Inc
Bought by
Williams Devon T
Current Estimated Value
Purchase Details
Closed on
Sep 25, 2009
Sold by
Klek Development
Bought by
K Future Builders Inc
Purchase Details
Closed on
Sep 4, 2009
Sold by
Us Bank Trust National Association
Bought by
Klek Development
Purchase Details
Closed on
May 8, 2009
Sold by
King Shirley
Bought by
Us Bank Trust National Association and The Sequoia Funding Trust
Purchase Details
Closed on
Jun 24, 1999
Sold by
Kash Tony
Bought by
King Shirley
Home Financials for this Owner
Home Financials are based on the most recent Mortgage that was taken out on this home.
Original Mortgage
$148,773
Interest Rate
7.68%
Mortgage Type
FHA
Purchase Details
Closed on
May 24, 1999
Sold by
Va
Bought by
Kash Tony
Home Financials for this Owner
Home Financials are based on the most recent Mortgage that was taken out on this home.
Original Mortgage
$148,773
Interest Rate
7.68%
Mortgage Type
FHA
Create a Home Valuation Report for This Property
The Home Valuation Report is an in-depth analysis detailing your home's value as well as a comparison with similar homes in the area
Home Values in the Area
Average Home Value in this Area
Purchase History
| Date | Buyer | Sale Price | Title Company |
|---|---|---|---|
| Williams Devon T | $197,000 | None Available | |
| K Future Builders Inc | -- | None Available | |
| Klek Development | $45,000 | Premier Title | |
| Us Bank Trust National Association | -- | None Available | |
| King Shirley | $150,000 | -- | |
| Kash Tony | -- | -- |
Source: Public Records
Mortgage History
| Date | Status | Borrower | Loan Amount |
|---|---|---|---|
| Previous Owner | King Shirley | $148,773 |
Source: Public Records
Tax History Compared to Growth
Tax History
| Year | Tax Paid | Tax Assessment Tax Assessment Total Assessment is a certain percentage of the fair market value that is determined by local assessors to be the total taxable value of land and additions on the property. | Land | Improvement |
|---|---|---|---|---|
| 2024 | $3,309 | $23,000 | $5,115 | $17,885 |
| 2023 | $3,204 | $19,000 | $4,092 | $14,908 |
| 2022 | $3,204 | $19,000 | $4,092 | $14,908 |
| 2021 | $3,151 | $19,000 | $4,092 | $14,908 |
| 2020 | $2,589 | $14,724 | $3,989 | $10,735 |
| 2019 | $2,598 | $16,361 | $3,989 | $12,372 |
| 2018 | $2,553 | $16,361 | $3,989 | $12,372 |
| 2017 | $3,248 | $15,086 | $3,478 | $11,608 |
| 2016 | $3,022 | $15,086 | $3,478 | $11,608 |
| 2015 | $2,764 | $15,086 | $3,478 | $11,608 |
| 2014 | $2,686 | $14,478 | $3,273 | $11,205 |
| 2013 | $2,633 | $14,478 | $3,273 | $11,205 |
Source: Public Records
Map
Nearby Homes
- 1418 N Mayfield Ave
- 1511 N Monitor Ave
- 1448 N Menard Ave
- 1346 N Monitor Ave
- 1322 N Austin Blvd
- 1622 N Mason Ave
- 102 Le Moyne Pkwy
- 1625 N Mcvicker Ave
- 1115 N Taylor Ave
- 1618 N Mcvicker Ave
- 1318 N Menard Ave
- 1415 N Massasoit Ave
- 1338 N Massasoit Ave
- 1657 N Austin Ave
- 1001 N Taylor Ave
- 1221 Hayes Ave
- 921 N Humphrey Ave
- 1308 N Waller Ave
- 910 N Humphrey Ave
- 1616 N Major Ave
- 1451 N Mason Ave
- 1447 N Mason Ave
- 1445 N Mason Ave
- 1457 N Mason Ave
- 1441 N Mason Ave
- 1439 N Mason Ave
- 1450 N Mayfield Ave
- 1454 N Mayfield Ave
- 1446 N Mayfield Ave
- 1456 N Mayfield Ave
- 1444 N Mayfield Ave
- 1435 N Mason Ave
- 1501 N Mason Ave
- 1440 N Mayfield Ave
- 1450 N Mason Ave
- 1448 N Mason Ave
- 1454 N Mason Ave
- 1436 N Mayfield Ave
- 1431 N Mason Ave
- 1505 N Mason Ave