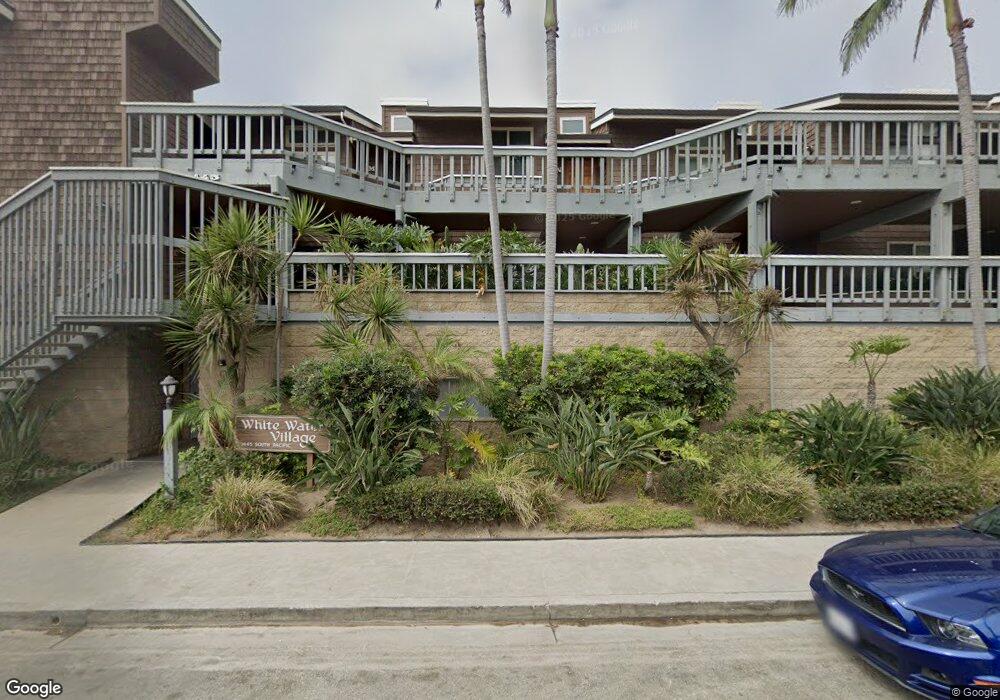
1455 S Pacific St Unit P Oceanside, CA 92054
Downtown Oceanside NeighborhoodEstimated Value: $1,149,436 - $1,431,000
1
Bed
2
Baths
860
Sq Ft
$1,567/Sq Ft
Est. Value
About This Home
This home is located at 1455 S Pacific St Unit P, Oceanside, CA 92054 and is currently estimated at $1,347,609, approximately $1,566 per square foot. 1455 S Pacific St Unit P is a home located in San Diego County with nearby schools including South Oceanside Elementary School, Lincoln Middle School, and Oceanside High School.
Ownership History
Date
Name
Owned For
Owner Type
Purchase Details
Closed on
Aug 2, 2016
Sold by
Aloha Mmg 311 Llc
Bought by
Turner Property Investments
Current Estimated Value
Purchase Details
Closed on
Feb 6, 2013
Sold by
Upward Trend Llc
Bought by
Aloha Mmg 311 Llc
Purchase Details
Closed on
Sep 10, 2012
Sold by
Wellman Timothy J
Bought by
Upward Trend Llc
Purchase Details
Closed on
Jan 5, 2004
Sold by
Oconnor John H and Oconnor Toni M
Bought by
Wellman Timothy J
Home Financials for this Owner
Home Financials are based on the most recent Mortgage that was taken out on this home.
Original Mortgage
$486,700
Interest Rate
5.25%
Mortgage Type
Unknown
Purchase Details
Closed on
Jan 28, 1993
Sold by
Oconnor John
Bought by
Oconnor John H and Oconnor Toni M
Purchase Details
Closed on
Sep 20, 1983
Create a Home Valuation Report for This Property
The Home Valuation Report is an in-depth analysis detailing your home's value as well as a comparison with similar homes in the area
Home Values in the Area
Average Home Value in this Area
Purchase History
| Date | Buyer | Sale Price | Title Company |
|---|---|---|---|
| Turner Property Investments | $720,000 | Chicago Title Company | |
| Aloha Mmg 311 Llc | $600,000 | Orange Coast Title Company | |
| Upward Trend Llc | $540,000 | None Available | |
| Wellman Timothy J | $649,000 | Chicago Title Co | |
| Oconnor John H | -- | -- | |
| -- | $235,000 | -- |
Source: Public Records
Mortgage History
| Date | Status | Borrower | Loan Amount |
|---|---|---|---|
| Previous Owner | Wellman Timothy J | $486,700 |
Source: Public Records
Tax History Compared to Growth
Tax History
| Year | Tax Paid | Tax Assessment Tax Assessment Total Assessment is a certain percentage of the fair market value that is determined by local assessors to be the total taxable value of land and additions on the property. | Land | Improvement |
|---|---|---|---|---|
| 2025 | $9,205 | $835,614 | $720,897 | $114,717 |
| 2024 | $9,205 | $819,230 | $706,762 | $112,468 |
| 2023 | $8,922 | $803,167 | $692,904 | $110,263 |
| 2022 | $8,787 | $787,419 | $679,318 | $108,101 |
| 2021 | $8,822 | $771,981 | $665,999 | $105,982 |
| 2020 | $8,549 | $764,066 | $659,170 | $104,896 |
| 2019 | $8,300 | $749,086 | $646,246 | $102,840 |
| 2018 | $8,212 | $734,399 | $633,575 | $100,824 |
| 2017 | $8,062 | $720,000 | $621,152 | $98,848 |
| 2016 | $6,902 | $624,034 | $538,361 | $85,673 |
| 2015 | $6,701 | $614,662 | $530,275 | $84,387 |
| 2014 | $6,440 | $602,622 | $519,888 | $82,734 |
Source: Public Records
Map
Nearby Homes
- 1445 S Pacific St
- 1445 S Pacific St Unit I
- 1601 S Pacific St Unit 1B
- 1409 S Pacific St
- 1401 S Pacific St Unit 205
- 1216 S Pacific St
- 1727 S Pacific St
- 1570 Vista Del Mar Way Unit 4
- 1573 Vista Del Mar Way
- Plan 6 at Tower 1888
- Plan 5 at Tower 1888
- Plan 4 at Tower 1888
- Plan 3 at Tower 1888
- Plan 2 at Tower 1888
- Plan 1 at Tower 1888
- 153 Sherri Ln
- 111 Sherri Ln
- 167 Sherri Ln
- 120 Sherri Ln
- 1506 Alvarado St
- 1455 S Pacific St Unit H
- 1445 S Pacific St Unit P
- 1445 S South Pacific St Unit K
- 1445 S Pacific St Unit ID1248651P
- 1445 S Pacific St Unit FL2-ID1059319P
- 1445 S Pacific St Unit O
- 1445 S Pacific Street #M
- 1445 S Pacific St Unit G
- 1445 S Pacific St Unit F
- 1445 S Pacific St Unit E
- 1445 S Pacific St Unit L
- 1445 S Pacific St Unit K
- 1445 S Pacific St Unit J
- 1445 S Pacific St Unit D
- 1445 S Pacific St Unit B
- 1445 S Pacific St Unit A
- 1445 S Pacific St Unit R
- 1445 S Pacific St Unit Q
- 1445 S Pacific St Unit N
- 1445 S Pacific St Unit M