
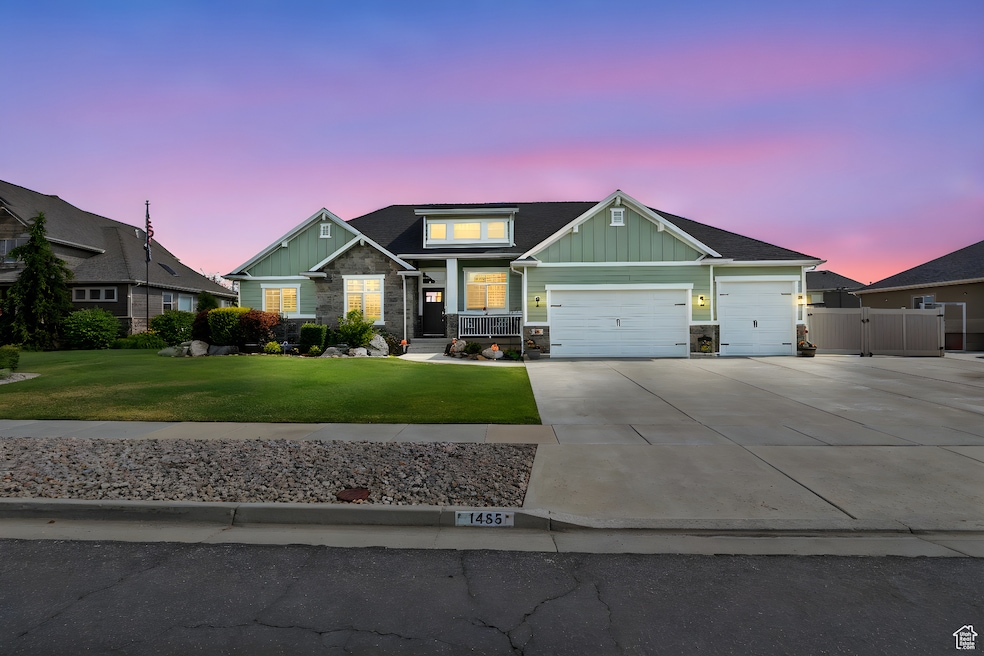
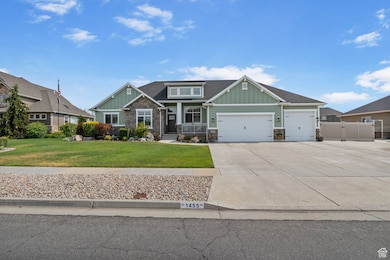


1455 W 600 S Layton, UT 84041
Estimated payment $4,491/month
Total Views
579
3
Beds
2.5
Baths
3,600
Sq Ft
$212
Price per Sq Ft
Highlights
- Hot Property
- Fruit Trees
- Secluded Lot
- RV or Boat Parking
- Mountain View
- Vaulted Ceiling
About This Home
Welcome Home! Immaculate Layton Rambler with Gorgeous Curb Appeal & Room to Grow. Step into picture-perfect living with this stunning rambler, nestled in a desirable Layton neighborhood. From the moment you arrive, the eye-catching curb appeal sets the tone, featuring meticulous landscaping, a durable Hardie board and stone exterior, and a charming covered front porch that looks like it belongs in Home & Garden magazine. Inside, you're greeted by a welcoming entryway that flows into a flexible front room ideal as a formal living space or home office. The home boasts soaring vaulted ceilings and a spacious open-concept layout, blending living, dining, and kitchen areas seamlessly. The kitchen is a chef's delight, complete with granite countertops, upgraded cabinetry, and newer high-end appliances-including a Frigidaire Pro microwave & oven, and a Samsung refrigerator and dishwasher. A stone gas fireplace with a decorative mantle provides both warmth and style, while tinted windows and plantation shutters add comfort and class throughout. The primary suite is a true retreat, offering a generous walk-in closet and a luxurious ensuite bathroom with granite counters, a jetted tub, and a separate shower. Step outside onto the large covered deck-perfect for summer barbecues, morning coffee, or quiet evenings. The beautifully landscaped .31-acre backyard is designed for both entertaining and relaxation, with direct access from the main level or walkout basement. The basement is framed and ready to be customized to fit your lifestyle. Whether you envision additional bedrooms, a home theater, a spacious rec room, or ample storage, this space is yours to design. Additional highlights include: 4-car garage with ample storage Cement RV parking with double gate for all your toys Convenient access to I-15 and Hwy 89 Minutes from IHC Layton Hospital, Hill Air Force Base, shopping, dining, schools, parks, and entertainment. Homes like this don't come around often-schedule your private showing today and see why this one checks all the boxes!
Home Details
Home Type
- Single Family
Est. Annual Taxes
- $3,433
Year Built
- Built in 2011
Lot Details
- 0.31 Acre Lot
- Property is Fully Fenced
- Landscaped
- Secluded Lot
- Terraced Lot
- Sprinkler System
- Fruit Trees
- Property is zoned Single-Family
Parking
- 4 Car Attached Garage
- Open Parking
- RV or Boat Parking
Home Design
- Rambler Architecture
- Pitched Roof
- Stone Siding
Interior Spaces
- 3,600 Sq Ft Home
- 2-Story Property
- Central Vacuum
- Vaulted Ceiling
- Ceiling Fan
- Self Contained Fireplace Unit Or Insert
- Gas Log Fireplace
- Double Pane Windows
- Plantation Shutters
- Entrance Foyer
- Den
- Mountain Views
Kitchen
- Built-In Oven
- Built-In Range
- Range Hood
- Microwave
- Granite Countertops
- Disposal
Flooring
- Wood
- Carpet
- Tile
Bedrooms and Bathrooms
- 3 Main Level Bedrooms
- Primary Bedroom on Main
- Walk-In Closet
- Hydromassage or Jetted Bathtub
- Bathtub With Separate Shower Stall
Laundry
- Dryer
- Washer
Basement
- Walk-Out Basement
- Basement Fills Entire Space Under The House
- Exterior Basement Entry
Home Security
- Home Security System
- Fire and Smoke Detector
Outdoor Features
- Covered patio or porch
Schools
- Heritage Elementary School
- Centennial Middle School
- Davis High School
Utilities
- Central Heating and Cooling System
- Natural Gas Connected
Community Details
- No Home Owners Association
- Phesant Place Subdivision
Listing and Financial Details
- Exclusions: Freezer, Gas Grill/BBQ, Humidifier, Workbench
- Assessor Parcel Number 11-631-0142
Map
Create a Home Valuation Report for This Property
The Home Valuation Report is an in-depth analysis detailing your home's value as well as a comparison with similar homes in the area
Home Values in the Area
Average Home Value in this Area
Tax History
| Year | Tax Paid | Tax Assessment Tax Assessment Total Assessment is a certain percentage of the fair market value that is determined by local assessors to be the total taxable value of land and additions on the property. | Land | Improvement |
|---|---|---|---|---|
| 2024 | $3,433 | $363,000 | $143,895 | $219,105 |
| 2023 | $3,434 | $640,000 | $153,397 | $486,603 |
| 2022 | $3,586 | $363,000 | $88,525 | $274,475 |
| 2021 | $3,206 | $484,000 | $132,761 | $351,239 |
| 2020 | $3,011 | $436,000 | $113,644 | $322,356 |
| 2019 | $2,884 | $409,000 | $111,829 | $297,171 |
| 2018 | $2,676 | $381,000 | $98,604 | $282,396 |
| 2016 | $2,592 | $190,356 | $41,201 | $149,155 |
| 2015 | $2,653 | $185,021 | $41,201 | $143,820 |
| 2014 | $2,869 | $204,550 | $41,201 | $163,349 |
| 2013 | -- | $173,250 | $42,015 | $131,235 |
Source: Public Records
Property History
| Date | Event | Price | Change | Sq Ft Price |
|---|---|---|---|---|
| 07/02/2025 07/02/25 | For Sale | $765,000 | -- | $213 / Sq Ft |
Source: UtahRealEstate.com
Purchase History
| Date | Type | Sale Price | Title Company |
|---|---|---|---|
| Deed | -- | Inwest Title | |
| Warranty Deed | -- | Mountain View Title | |
| Corporate Deed | -- | Security Title Of Davis Cnty |
Source: Public Records
Mortgage History
| Date | Status | Loan Amount | Loan Type |
|---|---|---|---|
| Open | $289,700 | New Conventional | |
| Closed | $248,890 | New Conventional | |
| Closed | $245,000 | New Conventional | |
| Closed | $235,000 | New Conventional | |
| Closed | $264,300 | New Conventional | |
| Previous Owner | $248,000 | FHA | |
| Previous Owner | $200,000 | Unknown |
Source: Public Records
Similar Homes in Layton, UT
Source: UtahRealEstate.com
MLS Number: 2096129
APN: 11-631-0142
Disclaimer: Certain information contained herein is derived from information provided by parties other than Homes.com. All information provided is deemed reliable, but is not guaranteed to be accurate and should be independently verified.
![]() IDX information is provided exclusively for consumers’ personal, non-commercial use, that it may not be used for any purpose other than to identify prospective properties consumers may be interested in purchasing, and that the data is deemed reliable but is not guaranteed accurate by the MLS. Licensor is only providing the MLS Content and not other sources of data provided in the Product.
IDX information is provided exclusively for consumers’ personal, non-commercial use, that it may not be used for any purpose other than to identify prospective properties consumers may be interested in purchasing, and that the data is deemed reliable but is not guaranteed accurate by the MLS. Licensor is only providing the MLS Content and not other sources of data provided in the Product.
Based on information from the Wasatch Front Regional Multiple Listing Service, Inc.. All data, including all measurements and calculations of area, is obtained from various sources and has not been, and will not be, verified by broker or the MLS. All information should be independently reviewed and verified for accuracy. Properties may or may not be listed by the office/agent presenting the information.
Nearby Homes
- 1381 W 425 S
- 1608 Boulder Creek Ln
- 632 S 1150 W
- 1792 W Norway Spruce Dr
- 958 S Bridge Creek Ln W
- 920 S 1700 W Unit 1
- 1042 W Shoreline Dr
- 146 S 1125 W
- 1071 Shoreline Dr
- 1333 W Gentile St
- 765 W Farming Way
- 1224 S Grace Way
- 933 W Gentile St
- 1415 S Bridgeview Dr
- 2245 W 800 S
- 163 Cold Creek Way
- 619 W 225 S
- 379 S 2300 W
- 544 W 425 S
- 1842 W Streams Edge Cir