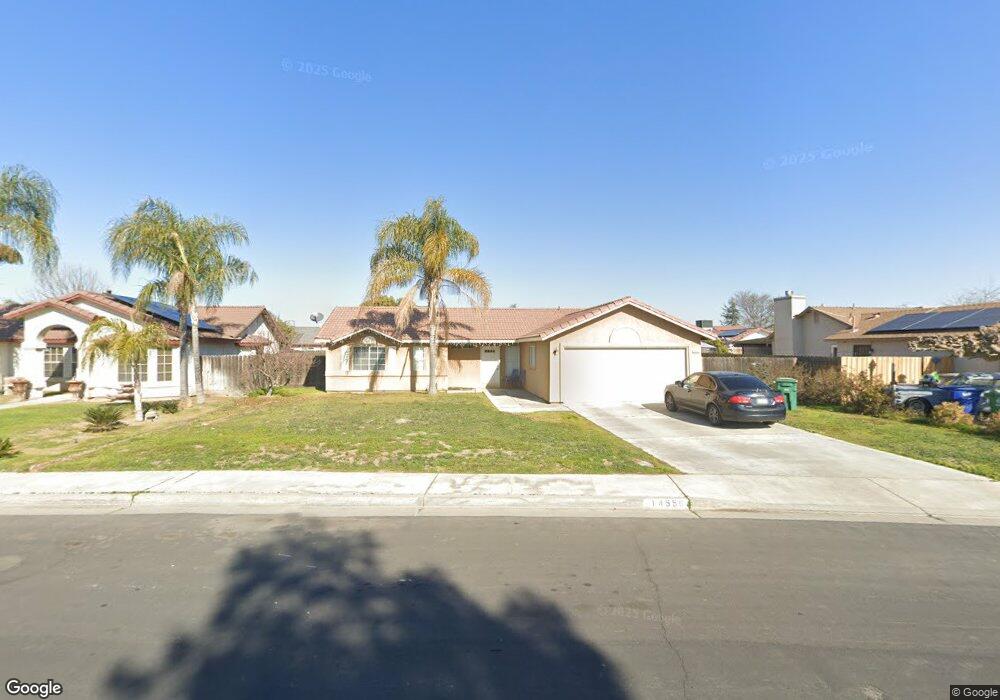
14550 W San Joaquin Ave Kerman, CA 93630
Estimated Value: $304,000 - $360,000
3
Beds
2
Baths
1,112
Sq Ft
$294/Sq Ft
Est. Value
About This Home
This home is located at 14550 W San Joaquin Ave, Kerman, CA 93630 and is currently estimated at $326,870, approximately $293 per square foot. 14550 W San Joaquin Ave is a home located in Fresno County with nearby schools including Kerman-Floyd Elementary School.
Ownership History
Date
Name
Owned For
Owner Type
Purchase Details
Closed on
Jun 22, 2011
Sold by
Brar Holdings Inc
Bought by
Murrieta Jesus Ramon Cabanillas
Current Estimated Value
Purchase Details
Closed on
May 12, 2011
Sold by
Secretary Of Housing & Urban Development
Bought by
Brar Holdings Inc
Purchase Details
Closed on
Mar 10, 2010
Sold by
California Housing Finance Agency
Bought by
The Secretary Of Housing & Urban Develop
Purchase Details
Closed on
Mar 9, 2010
Sold by
Kaler Kulwant Singh and Kaler Jasvir Kaur
Bought by
California Housing Finance Agency
Purchase Details
Closed on
Dec 2, 1997
Sold by
Valley Vanguard Properties Inc
Bought by
Kaler Kulwant Singh and Kaler Jasvir Kaur
Home Financials for this Owner
Home Financials are based on the most recent Mortgage that was taken out on this home.
Original Mortgage
$84,301
Interest Rate
6.99%
Mortgage Type
FHA
Create a Home Valuation Report for This Property
The Home Valuation Report is an in-depth analysis detailing your home's value as well as a comparison with similar homes in the area
Home Values in the Area
Average Home Value in this Area
Purchase History
| Date | Buyer | Sale Price | Title Company |
|---|---|---|---|
| Murrieta Jesus Ramon Cabanillas | $100,000 | First American Title Company | |
| Brar Holdings Inc | $75,000 | Chicago Title Company | |
| The Secretary Of Housing & Urban Develop | -- | Landsafe Title | |
| California Housing Finance Agency | $81,727 | Landsafe Title | |
| Kaler Kulwant Singh | $85,000 | Central Title Company |
Source: Public Records
Mortgage History
| Date | Status | Borrower | Loan Amount |
|---|---|---|---|
| Previous Owner | Kaler Kulwant Singh | $84,301 | |
| Closed | Kaler Kulwant Singh | $4,000 |
Source: Public Records
Tax History Compared to Growth
Tax History
| Year | Tax Paid | Tax Assessment Tax Assessment Total Assessment is a certain percentage of the fair market value that is determined by local assessors to be the total taxable value of land and additions on the property. | Land | Improvement |
|---|---|---|---|---|
| 2025 | $1,154 | $96,073 | $44,833 | $51,240 |
| 2023 | $1,148 | $92,344 | $43,093 | $49,251 |
| 2022 | $1,140 | $90,535 | $42,249 | $48,286 |
| 2021 | $1,124 | $88,761 | $41,421 | $47,340 |
| 2020 | $1,113 | $87,852 | $40,997 | $46,855 |
| 2019 | $1,107 | $86,131 | $40,194 | $45,937 |
| 2018 | $1,062 | $84,443 | $39,406 | $45,037 |
| 2017 | $1,053 | $82,788 | $38,634 | $44,154 |
| 2016 | $965 | $81,166 | $37,877 | $43,289 |
| 2015 | $957 | $79,948 | $37,309 | $42,639 |
| 2014 | $936 | $78,383 | $36,579 | $41,804 |
Source: Public Records
Map
Nearby Homes
- 315 S Bordeaux Ave
- 220 S Madera Ave Unit SPC 9
- 14288 W El Mar Ave
- 15245 W El Mar Ln
- 575 S 8th St
- 14621 W C St
- 505 S Del Norte Ave
- 15412 W B St
- 15906 W C St
- 16052 W Middleton Ave
- 16101 W San Joaquin Ave
- 910 S Siskiyou Ave
- 799 S Joseph Ave
- 15963 W Jensen Ave
- 1 S Bishop Ave
- 350 N Floyd Ave
- 251 N Trinity Ave
- 0 North
- 0 W Dan Ronquillo Dr S Roeding D Unit 636403
- 3858 N Siskiyou Ave
- 14556 W San Joaquin Ave
- 14540 W San Joaquin Ave
- 14551 W El Mar Ave
- 14541 W El Mar Ave
- 14553 W El Mar Ave
- 14560 W San Joaquin Ave
- 14538 W San Joaquin Ave
- 14537 W El Mar Ave
- 14557 W San Joaquin Ave
- 14559 W El Mar Ave
- 14551 W San Joaquin Ave
- 14545 W San Joaquin Ave
- 14566 W San Joaquin Ave
- 14530 W San Joaquin Ave
- 14563 W San Joaquin Ave
- 14539 W San Joaquin Ave
- 14529 W El Mar Ave
- 14567 W El Mar Ave
- 14546 W El Mar Ave
- 14552 W El Mar Ave