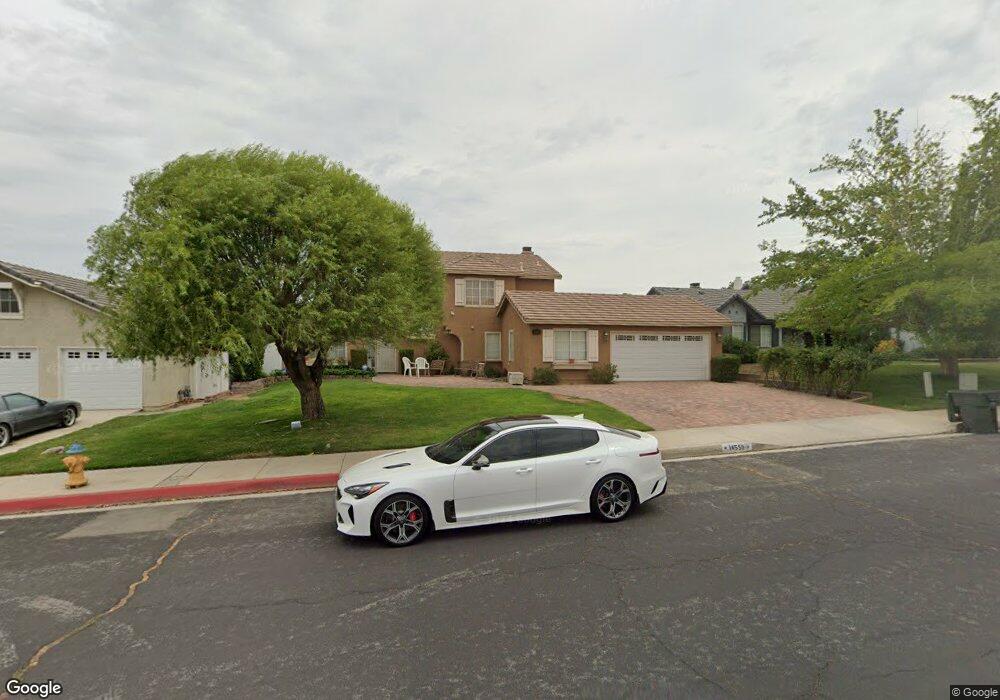
14559 Oak Branch Rd Victorville, CA 92392
Mesa Linda NeighborhoodEstimated Value: $422,999 - $482,000
5
Beds
3
Baths
2,165
Sq Ft
$211/Sq Ft
Est. Value
About This Home
This home is located at 14559 Oak Branch Rd, Victorville, CA 92392 and is currently estimated at $456,750, approximately $210 per square foot. 14559 Oak Branch Rd is a home located in San Bernardino County with nearby schools including Liberty Elementary School, Park View Elementary School, and Imogene Garner Hook Junior High School.
Ownership History
Date
Name
Owned For
Owner Type
Purchase Details
Closed on
Apr 10, 2006
Sold by
Gonzalez Ernie
Bought by
Gonzalez Ernie and Gonzalez April
Current Estimated Value
Home Financials for this Owner
Home Financials are based on the most recent Mortgage that was taken out on this home.
Original Mortgage
$324,000
Outstanding Balance
$196,115
Interest Rate
7.3%
Mortgage Type
Balloon
Estimated Equity
$260,635
Purchase Details
Closed on
Feb 4, 2005
Sold by
Gonzalez Ernie H
Bought by
Gonzalez Ernie H and Gonzalez April
Home Financials for this Owner
Home Financials are based on the most recent Mortgage that was taken out on this home.
Original Mortgage
$204,750
Interest Rate
7.25%
Mortgage Type
New Conventional
Purchase Details
Closed on
Jun 23, 1994
Sold by
Va
Bought by
Gonzalez Ernie H and Coley April
Home Financials for this Owner
Home Financials are based on the most recent Mortgage that was taken out on this home.
Original Mortgage
$115,001
Interest Rate
8.65%
Mortgage Type
Seller Take Back
Create a Home Valuation Report for This Property
The Home Valuation Report is an in-depth analysis detailing your home's value as well as a comparison with similar homes in the area
Home Values in the Area
Average Home Value in this Area
Purchase History
| Date | Buyer | Sale Price | Title Company |
|---|---|---|---|
| Gonzalez Ernie | -- | Southland Title | |
| Gonzalez Ernie H | -- | Commerce Title Company | |
| Gonzalez Ernie H | $115,500 | Gateway Title Company |
Source: Public Records
Mortgage History
| Date | Status | Borrower | Loan Amount |
|---|---|---|---|
| Open | Gonzalez Ernie | $324,000 | |
| Closed | Gonzalez Ernie H | $204,750 | |
| Previous Owner | Gonzalez Ernie H | $115,001 |
Source: Public Records
Tax History Compared to Growth
Tax History
| Year | Tax Paid | Tax Assessment Tax Assessment Total Assessment is a certain percentage of the fair market value that is determined by local assessors to be the total taxable value of land and additions on the property. | Land | Improvement |
|---|---|---|---|---|
| 2025 | $2,318 | $193,164 | $48,374 | $144,790 |
| 2024 | $2,318 | $189,376 | $47,425 | $141,951 |
| 2023 | $2,295 | $185,663 | $46,495 | $139,168 |
| 2022 | $2,256 | $182,022 | $45,583 | $136,439 |
| 2021 | $2,216 | $178,453 | $44,689 | $133,764 |
| 2020 | $2,177 | $176,623 | $44,231 | $132,392 |
| 2019 | $2,142 | $173,160 | $43,364 | $129,796 |
| 2018 | $2,279 | $169,765 | $42,514 | $127,251 |
| 2017 | $2,233 | $166,436 | $41,680 | $124,756 |
| 2016 | $2,189 | $163,173 | $40,863 | $122,310 |
| 2015 | $2,113 | $160,722 | $40,249 | $120,473 |
| 2014 | $2,073 | $157,574 | $39,461 | $118,113 |
Source: Public Records
Map
Nearby Homes
- 14549 Stallion Trail
- 14535 Owens River Rd
- 14583 Owens River Rd
- 14698 King Canyon Rd
- 14748 La Mesa Rd
- 12610 Alta Mar Way
- 14390 Northstar Ave
- 14660 La Habra Rd
- 14230 Hillsborough Dr
- 14561 Manzano Rd
- 14488 Manzano Rd
- 12761 Paso Robles Dr
- 12960 El Rio Rd
- 14200 La Mirada St
- 12441 Petaluma Rd
- 14133 Pacoima Cir
- 4 Peral Rd
- 14195 Whispering Sands Dr
- 14609 Olivera Rd
- 0 Nisqualli Rd Unit HD25227455
- 14545 Oak Branch Rd
- 14569 Oak Branch Rd
- 14554 King Canyon Rd
- 14540 King Canyon Rd
- 14568 King Canyon Rd
- 14535 Oak Branch Rd
- 14581 Oak Branch Rd
- 14548 Oak Branch Rd
- 14534 King Canyon Rd
- 14538 Oak Branch Rd
- 14570 Oak Branch Rd
- 14582 King Canyon Rd
- 14595 Oak Branch Rd
- 14584 Oak Branch Rd
- 14532 Oak Branch Rd
- 14547 King Canyon Rd
- 14559 King Canyon Rd
- 14594 King Canyon Rd
- 14539 Stallion Trail
- 14571 Stallion Trail