Estimated Value: $462,970 - $533,000
3
Beds
2
Baths
1,040
Sq Ft
$488/Sq Ft
Est. Value
About This Home
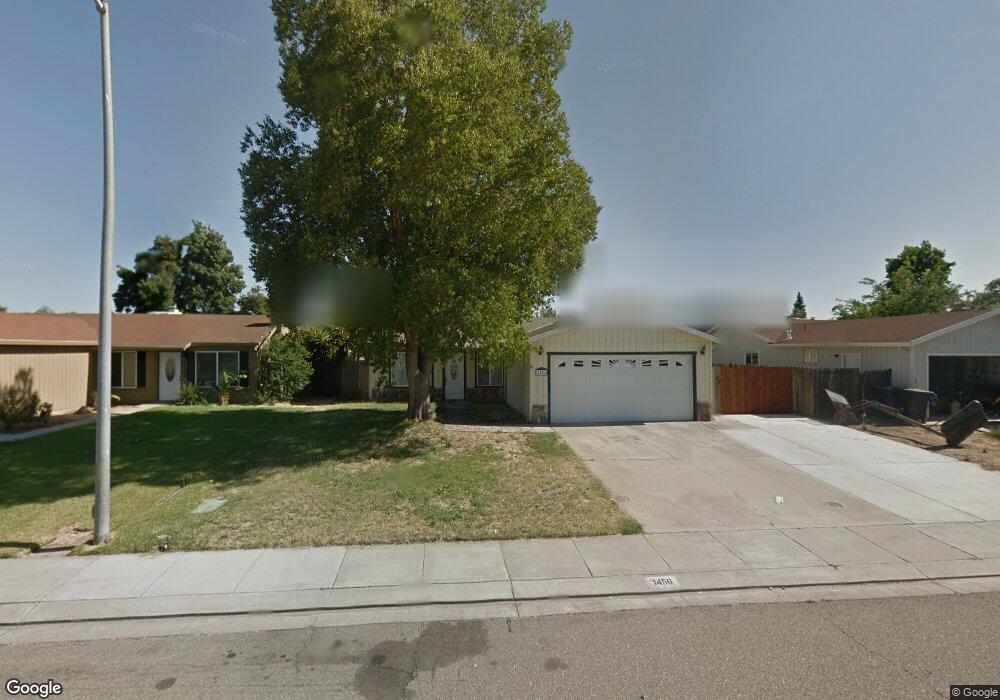
This home is located at 1456 7th St, Ripon, CA 95366 and is currently estimated at $507,993, approximately $488 per square foot. 1456 7th St is a home located in San Joaquin County with nearby schools including Weston Elementary School, Ripon Elementary School, and Ripona Elementary School.
Ownership History
Date
Name
Owned For
Owner Type
Purchase Details
Closed on
Jul 22, 2025
Sold by
Lee Eric and Lee Winnie B
Bought by
Eric And Winnie Lee Living Trust and Lee
Current Estimated Value
Purchase Details
Closed on
Oct 4, 2011
Sold by
Secretary Of Housing & Urban Development
Bought by
Lee Eric and Lee Winnie B
Home Financials for this Owner
Home Financials are based on the most recent Mortgage that was taken out on this home.
Original Mortgage
$85,725
Interest Rate
4.16%
Mortgage Type
New Conventional
Purchase Details
Closed on
Jun 7, 2011
Sold by
Wells Fargo Bank Na
Bought by
Secretary Of The Department Of Housing &
Purchase Details
Closed on
Oct 27, 2010
Sold by
Texeira Curtis and Texeira Keith
Bought by
Wells Fargo Bank Na
Purchase Details
Closed on
Jun 19, 2008
Sold by
U S Bank Na
Bought by
Texeira Curtis and Texeira Keith
Home Financials for this Owner
Home Financials are based on the most recent Mortgage that was taken out on this home.
Original Mortgage
$189,033
Interest Rate
5.99%
Mortgage Type
FHA
Purchase Details
Closed on
Apr 9, 2008
Sold by
Hoover Danny J and Hoover Carol D
Bought by
U S Bank Na and First Franklin Mortgage Loan Trust
Purchase Details
Closed on
Aug 3, 2005
Sold by
Hoover Danny J and Hoover Carol D
Bought by
Hoover Danny J and Hoover Carol D
Home Financials for this Owner
Home Financials are based on the most recent Mortgage that was taken out on this home.
Original Mortgage
$318,750
Interest Rate
8.5%
Mortgage Type
Stand Alone First
Purchase Details
Closed on
Jan 31, 2005
Sold by
Hoover Danny J and Hoover Carol D
Bought by
Hoover Danny J and Hoover Carol D
Home Financials for this Owner
Home Financials are based on the most recent Mortgage that was taken out on this home.
Original Mortgage
$236,000
Interest Rate
7.75%
Mortgage Type
Purchase Money Mortgage
Purchase Details
Closed on
Oct 4, 2001
Sold by
Burrows Frances J
Bought by
Hoover Danny J and Hoover Carol D
Create a Home Valuation Report for This Property
The Home Valuation Report is an in-depth analysis detailing your home's value as well as a comparison with similar homes in the area
Home Values in the Area
Average Home Value in this Area
Purchase History
| Date | Buyer | Sale Price | Title Company |
|---|---|---|---|
| Eric And Winnie Lee Living Trust | -- | None Listed On Document | |
| Lee Eric | $114,500 | Chicago Title Company | |
| Secretary Of The Department Of Housing & | -- | Pasion Title Services | |
| Wells Fargo Bank Na | $201,572 | Accommodation | |
| Texeira Curtis | $192,000 | First American Title Company | |
| U S Bank Na | $263,225 | Accommodation | |
| Hoover Danny J | -- | Commonwealth Title Co | |
| Hoover Danny J | -- | North Amer Title Co | |
| Hoover Danny J | -- | Old Republic Title Company |
Source: Public Records
Mortgage History
| Date | Status | Borrower | Loan Amount |
|---|---|---|---|
| Previous Owner | Lee Eric | $85,725 | |
| Previous Owner | Texeira Curtis | $189,033 | |
| Previous Owner | Hoover Danny J | $318,750 | |
| Previous Owner | Hoover Danny J | $236,000 |
Source: Public Records
Tax History
| Year | Tax Paid | Tax Assessment Tax Assessment Total Assessment is a certain percentage of the fair market value that is determined by local assessors to be the total taxable value of land and additions on the property. | Land | Improvement |
|---|---|---|---|---|
| 2025 | $1,623 | $143,557 | $35,166 | $108,391 |
| 2024 | $1,597 | $140,743 | $34,477 | $106,266 |
| 2023 | $1,566 | $137,984 | $33,801 | $104,183 |
| 2022 | $1,541 | $135,280 | $33,139 | $102,141 |
| 2021 | $1,519 | $132,629 | $32,490 | $100,139 |
| 2020 | $1,505 | $131,270 | $32,157 | $99,113 |
| 2019 | $1,480 | $128,697 | $31,527 | $97,170 |
| 2018 | $1,459 | $126,174 | $30,909 | $95,265 |
| 2017 | $1,431 | $123,701 | $30,303 | $93,398 |
| 2016 | $1,408 | $121,276 | $29,709 | $91,567 |
| 2015 | $1,392 | $119,455 | $29,263 | $90,192 |
| 2014 | $1,357 | $117,116 | $28,690 | $88,426 |
Source: Public Records
Map
Nearby Homes
- 924 Kingery Dr
- 1122 Zumstein Ct
- 1601 Stanley Dr
- 23811 S Jack Tone Rd
- 1672 Bailey Dr
- 1315 Augusta Pointe Dr
- 1080 Ruess Rd
- 1434 Augusta Pointe Dr
- 1621 Davis St
- 1691 Davis St
- 916 6th St
- 602 S Highland Ave
- 138 Roxie Ct
- 336 Kristen Way
- 1191 S Mohler Rd
- 1187 S Mohler Rd
- 547 Sepp Ct
- 205 3rd St
- 150 N Acacia Ave
- 410 Pine St
Your Personal Tour Guide
Ask me questions while you tour the home.