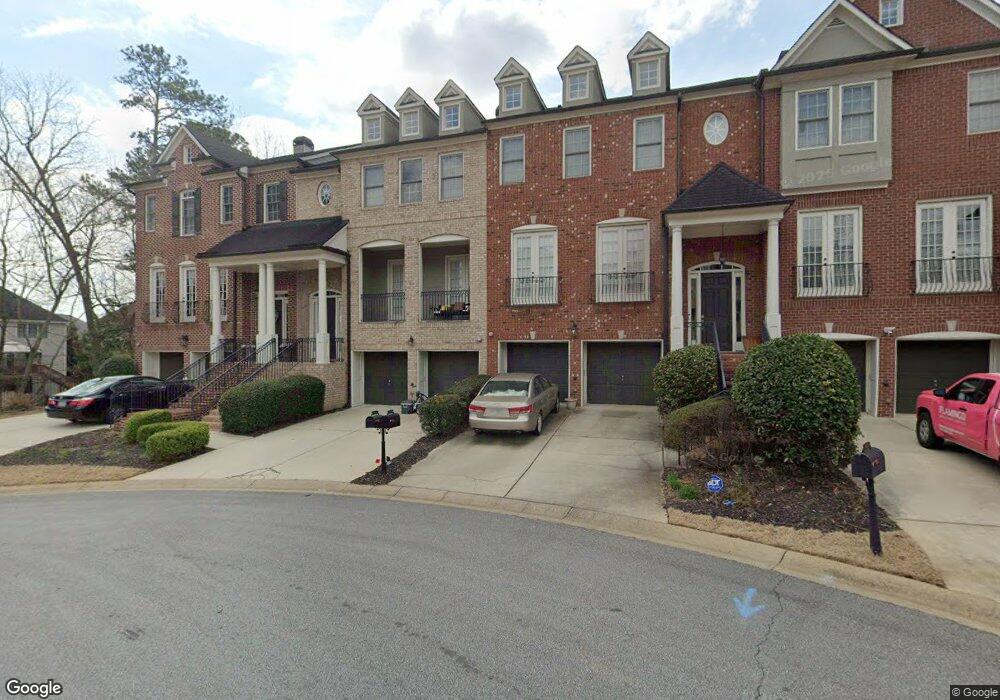
1456 Montclair Ct SE Unit 31 Smyrna, GA 30080
Estimated Value: $495,490 - $572,000
3
Beds
3
Baths
2,712
Sq Ft
$200/Sq Ft
Est. Value
About This Home
This home is located at 1456 Montclair Ct SE Unit 31, Smyrna, GA 30080 and is currently estimated at $542,623, approximately $200 per square foot. 1456 Montclair Ct SE Unit 31 is a home located in Cobb County with nearby schools including Smyrna Elementary School, Campbell Middle School, and Campbell High School.
Ownership History
Date
Name
Owned For
Owner Type
Purchase Details
Closed on
Nov 16, 2016
Sold by
Williams David J and Williams Brittany
Bought by
Ollison Brian
Current Estimated Value
Home Financials for this Owner
Home Financials are based on the most recent Mortgage that was taken out on this home.
Original Mortgage
$306,000
Outstanding Balance
$245,782
Interest Rate
3.52%
Mortgage Type
New Conventional
Estimated Equity
$296,841
Purchase Details
Closed on
Nov 2, 2012
Sold by
Williams David J
Bought by
Williams David J and Williams Brittany
Home Financials for this Owner
Home Financials are based on the most recent Mortgage that was taken out on this home.
Original Mortgage
$275,900
Interest Rate
3.4%
Mortgage Type
New Conventional
Purchase Details
Closed on
Jan 30, 2003
Sold by
Ashton Atlanta Residential Llc
Bought by
Williams David J
Home Financials for this Owner
Home Financials are based on the most recent Mortgage that was taken out on this home.
Original Mortgage
$229,125
Interest Rate
5.13%
Mortgage Type
New Conventional
Create a Home Valuation Report for This Property
The Home Valuation Report is an in-depth analysis detailing your home's value as well as a comparison with similar homes in the area
Home Values in the Area
Average Home Value in this Area
Purchase History
| Date | Buyer | Sale Price | Title Company |
|---|---|---|---|
| Ollison Brian | $340,000 | -- | |
| Williams David J | -- | -- | |
| Williams David J | $286,500 | -- |
Source: Public Records
Mortgage History
| Date | Status | Borrower | Loan Amount |
|---|---|---|---|
| Open | Ollison Brian | $306,000 | |
| Previous Owner | Williams David J | $275,900 | |
| Previous Owner | Williams David J | $229,125 |
Source: Public Records
Tax History Compared to Growth
Tax History
| Year | Tax Paid | Tax Assessment Tax Assessment Total Assessment is a certain percentage of the fair market value that is determined by local assessors to be the total taxable value of land and additions on the property. | Land | Improvement |
|---|---|---|---|---|
| 2025 | $4,353 | $188,801 | $40,000 | $148,801 |
| 2024 | $4,500 | $196,668 | $40,000 | $156,668 |
| 2023 | $3,482 | $168,376 | $30,000 | $138,376 |
| 2022 | $4,002 | $168,376 | $30,000 | $138,376 |
| 2021 | $3,501 | $140,868 | $30,000 | $110,868 |
| 2020 | $3,872 | $140,868 | $30,000 | $110,868 |
| 2019 | $3,553 | $129,260 | $30,000 | $99,260 |
| 2018 | $3,553 | $129,260 | $30,000 | $99,260 |
| 2017 | $2,874 | $111,440 | $32,000 | $79,440 |
| 2016 | $2,618 | $111,440 | $32,000 | $79,440 |
| 2015 | $2,471 | $103,440 | $24,000 | $79,440 |
| 2014 | $1,933 | $82,380 | $0 | $0 |
Source: Public Records
Map
Nearby Homes
- 3018 Montclair Cir SE Unit 57
- 3028 Montclair Cir SE
- 3064 Montclair Cir SE
- 1652 Mosaic Way
- 1582 Mosaic Way Unit 1582
- 1303 Vinings Forest Ln SE
- 1203 Vinings Forest Ln SE Unit 12
- 1460 Memory Ln SE
- 1552 Mosaic Way
- 1560 Mosaic Way
- 1483 Collier Dr SE
- 812 Vinings Forest Ln SE Unit 812
- 2861 Bernard Ln SE
- 2964 Anderson Cir SE
- 2999 Jonquil Dr SE
- 3211 Collier Gate Ct SE
- 1454 Montclair Ct SE Unit 32
- 1452 Montclair Ct SE Unit 33
- 1450 Montclair Ct SE Unit 34
- 3021 Montclair Cir SE Unit 2
- 3025 Montclair Cir SE Unit 3025
- 3025 Montclair Cir SE Unit 50
- 3023 Montclair Cir SE Unit 3023
- 3023 Montclair Cir SE Unit 49
- 3023 Montclair Cir SE
- 3019 Montclair Cir SE Unit 47
- 3019 Montclair Cir SE
- 3027 Montclair Cir SE Unit 51
- 3017 Montclair Cir SE
- 3017 Montclair Cir SE Unit 3017
- 1444 Montclair Ct SE Unit 1444
- 1444 Montclair Ct SE Unit 35
- 1444 Montclair Ct SE
- 3015 Montclair Cir SE Unit 45
- 3068 Montclair Cir SE Unit 1
- 1442 Montclair Ct SE Unit 36