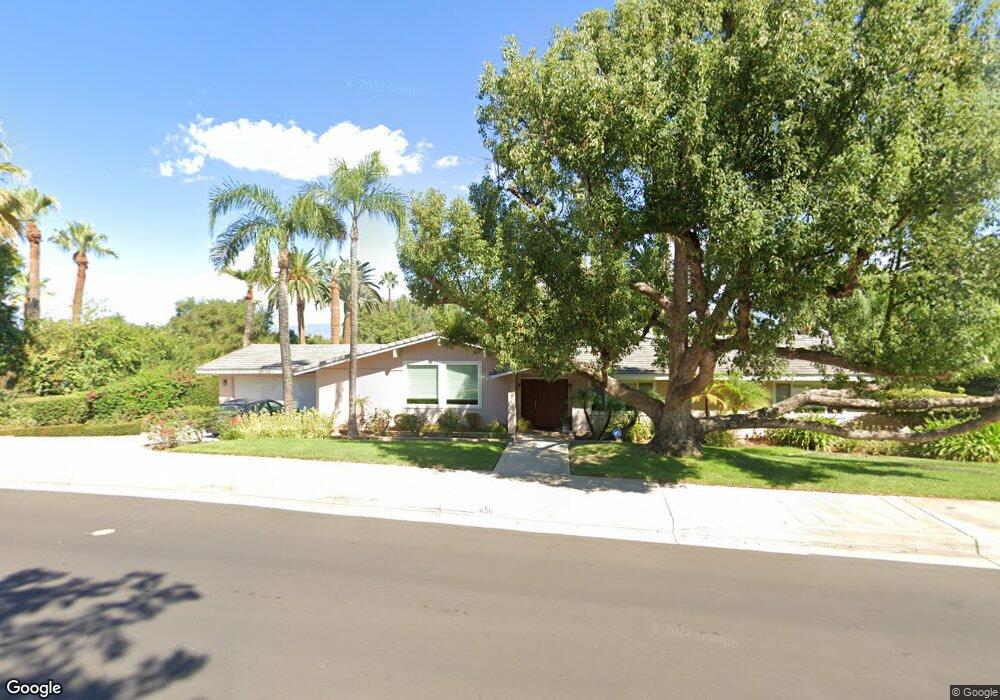
1456 Smiley Heights Dr Redlands, CA 92373
Live Oak Canyon NeighborhoodEstimated Value: $874,000 - $1,344,000
4
Beds
2
Baths
2,644
Sq Ft
$406/Sq Ft
Est. Value
About This Home
This home is located at 1456 Smiley Heights Dr, Redlands, CA 92373 and is currently estimated at $1,072,647, approximately $405 per square foot. 1456 Smiley Heights Dr is a home located in San Bernardino County with nearby schools including Smiley Elementary School, Cope Middle School, and Redlands Senior High School.
Ownership History
Date
Name
Owned For
Owner Type
Purchase Details
Closed on
Dec 7, 2021
Sold by
Ndlela Bella Babs
Bought by
Johannes Charles Ndlela And Bella Babs Ndlela and Ndlela Be
Current Estimated Value
Purchase Details
Closed on
Aug 15, 2007
Sold by
Bellah Ndlela Johannes C and Bellah Ndlela
Bought by
Ndlela Johannes Charles and Ndlela Bella Babs
Purchase Details
Closed on
Dec 16, 1998
Sold by
Zaibag Muayed
Bought by
Bellah Ndlela Johannes C and Bellah Ndlela
Home Financials for this Owner
Home Financials are based on the most recent Mortgage that was taken out on this home.
Original Mortgage
$359,600
Interest Rate
6.73%
Purchase Details
Closed on
May 31, 1994
Sold by
Galena Investment Ltd Partnership
Bought by
Zaibag Muayed
Home Financials for this Owner
Home Financials are based on the most recent Mortgage that was taken out on this home.
Original Mortgage
$294,500
Interest Rate
5.5%
Create a Home Valuation Report for This Property
The Home Valuation Report is an in-depth analysis detailing your home's value as well as a comparison with similar homes in the area
Home Values in the Area
Average Home Value in this Area
Purchase History
| Date | Buyer | Sale Price | Title Company |
|---|---|---|---|
| Johannes Charles Ndlela And Bella Babs Ndlela | -- | -- | |
| Ndlela Johannes Charles | -- | None Available | |
| Bellah Ndlela Johannes C | $400,000 | Chicago Title Co | |
| Zaibag Muayed | $310,000 | First American Title Ins Co |
Source: Public Records
Mortgage History
| Date | Status | Borrower | Loan Amount |
|---|---|---|---|
| Previous Owner | Bellah Ndlela Johannes C | $359,600 | |
| Previous Owner | Zaibag Muayed | $294,500 |
Source: Public Records
Tax History
| Year | Tax Paid | Tax Assessment Tax Assessment Total Assessment is a certain percentage of the fair market value that is determined by local assessors to be the total taxable value of land and additions on the property. | Land | Improvement |
|---|---|---|---|---|
| 2025 | $7,699 | $627,093 | $156,773 | $470,320 |
| 2024 | $7,185 | $614,797 | $153,699 | $461,098 |
| 2023 | $7,175 | $602,742 | $150,685 | $452,057 |
| 2022 | $7,070 | $590,923 | $147,730 | $443,193 |
| 2021 | $7,198 | $579,336 | $144,833 | $434,503 |
| 2020 | $7,089 | $573,396 | $143,348 | $430,048 |
| 2019 | $6,888 | $562,153 | $140,537 | $421,616 |
| 2018 | $6,714 | $551,130 | $137,781 | $413,349 |
| 2017 | $6,656 | $540,323 | $135,079 | $405,244 |
| 2016 | $6,579 | $529,728 | $132,430 | $397,298 |
| 2015 | $6,529 | $521,771 | $130,441 | $391,330 |
| 2014 | $6,409 | $511,550 | $127,886 | $383,664 |
Source: Public Records
Map
Nearby Homes
- 947 Nottingham Dr
- 1205 W Highland Ave
- 726 Robinhood Ln
- 1235 W Cypress Ave
- 1117 W Crescent Ave
- 1221 San Jacinto St
- 1033 W Palm Ave
- 1029 W Palm Ave
- 31615 Live Oak Canyon Rd
- 571 Wooden Bridge Ln
- 1612 Bellevue Rd
- 616 Monterey St
- 909 W Crescent Ave
- 215 San Rafael St
- 400 Walnut Ave
- 1608 Smiley Ridge
- 162 Lakeside Ave
- 171 Bellevue Ave
- 527 W Palm Ave
- 1030 Fallbrook Ave
- 1460 Smiley Heights Dr
- 1450 Smiley Heights Dr
- 1455 Smiley Heights Dr
- 1204 Serpentine Dr
- 1460 Piedmont Ln
- 1464 Smiley Heights Dr
- 1218 Arroyo Crescent
- 1464 Piedmont Ln
- 1217 Drake Ridge Crescent
- 1221 Arroyo Crescent
- 1460 Edgehill Ln
- 1222 Drake Ridge Crest
- 1222 Drake Ridge Crescent
- 1464 Rosehill Crescent
- 1468 Smiley Heights Dr
- 1211 Serpentine Dr
- 1215 Serpentine Dr
- 1000 Serpentine Dr
- 1468 Piedmont Ln
- 1467 Smiley Heights Dr
Your Personal Tour Guide
Ask me questions while you tour the home.