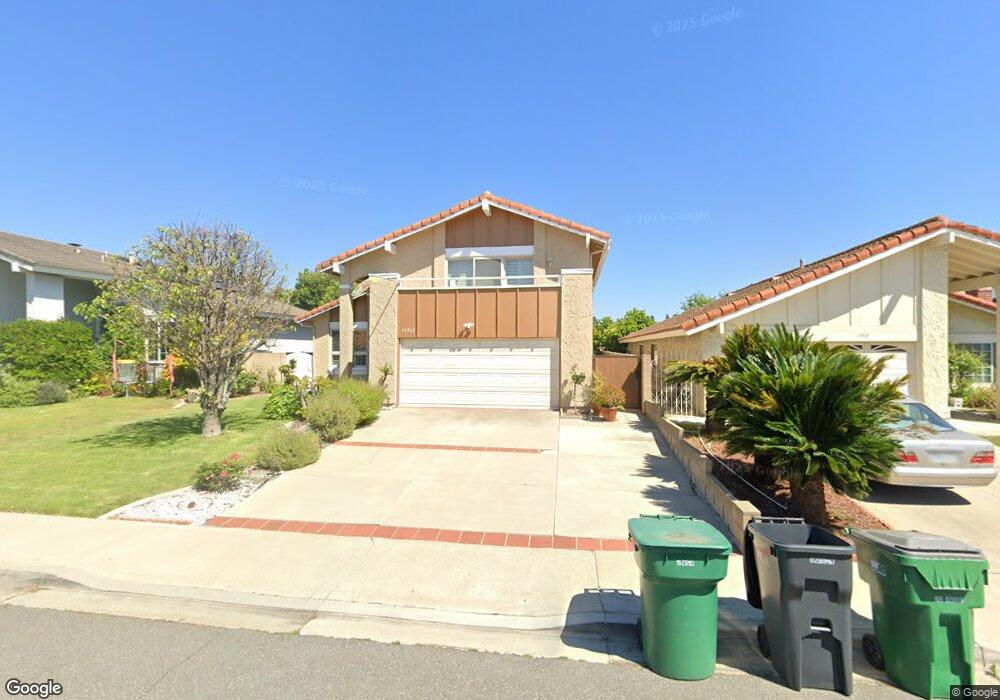
14562 Savin Ave Irvine, CA 92606
Walnut NeighborhoodEstimated Value: $1,354,000 - $1,843,000
4
Beds
3
Baths
2,277
Sq Ft
$733/Sq Ft
Est. Value
About This Home
This home is located at 14562 Savin Ave, Irvine, CA 92606 and is currently estimated at $1,669,131, approximately $733 per square foot. 14562 Savin Ave is a home located in Orange County with nearby schools including College Park Elementary School, Venado Middle School, and Irvine High School.
Ownership History
Date
Name
Owned For
Owner Type
Purchase Details
Closed on
Jul 17, 2025
Sold by
Tseng Margaret Pei-Wei and Yen Alex
Bought by
Alex Liwei Yen And Pei Wei Tseng Living Trust and Yen
Current Estimated Value
Purchase Details
Closed on
Sep 19, 2002
Sold by
Yen Alex and Tseng Margaret Pei Wei
Bought by
Yen Alex and Tseng Margaret Pei Wei
Home Financials for this Owner
Home Financials are based on the most recent Mortgage that was taken out on this home.
Original Mortgage
$300,700
Interest Rate
6.09%
Purchase Details
Closed on
May 8, 2002
Sold by
Hackworth Ora T and Hackworth Dolores M
Bought by
Yen Alex and Tseng Margaret Pei Wei
Home Financials for this Owner
Home Financials are based on the most recent Mortgage that was taken out on this home.
Original Mortgage
$300,700
Interest Rate
6.74%
Create a Home Valuation Report for This Property
The Home Valuation Report is an in-depth analysis detailing your home's value as well as a comparison with similar homes in the area
Home Values in the Area
Average Home Value in this Area
Purchase History
| Date | Buyer | Sale Price | Title Company |
|---|---|---|---|
| Alex Liwei Yen And Pei Wei Tseng Living Trust | -- | None Listed On Document | |
| Yen Alex | -- | Investors Title Company | |
| Yen Alex | $480,000 | Lawyers Title Company |
Source: Public Records
Mortgage History
| Date | Status | Borrower | Loan Amount |
|---|---|---|---|
| Previous Owner | Yen Alex | $300,700 | |
| Previous Owner | Yen Alex | $300,700 |
Source: Public Records
Tax History
| Year | Tax Paid | Tax Assessment Tax Assessment Total Assessment is a certain percentage of the fair market value that is determined by local assessors to be the total taxable value of land and additions on the property. | Land | Improvement |
|---|---|---|---|---|
| 2025 | $7,341 | $709,095 | $518,830 | $190,265 |
| 2024 | $7,341 | $695,192 | $508,657 | $186,535 |
| 2023 | $7,150 | $681,561 | $498,683 | $182,878 |
| 2022 | $7,012 | $668,198 | $488,905 | $179,293 |
| 2021 | $6,851 | $655,097 | $479,319 | $175,778 |
| 2020 | $6,812 | $648,380 | $474,404 | $173,976 |
| 2019 | $6,660 | $635,667 | $465,102 | $170,565 |
| 2018 | $6,541 | $623,203 | $455,982 | $167,221 |
| 2017 | $6,406 | $610,984 | $447,041 | $163,943 |
| 2016 | $6,121 | $599,004 | $438,275 | $160,729 |
| 2015 | $6,029 | $590,007 | $431,692 | $158,315 |
| 2014 | $5,911 | $578,450 | $423,236 | $155,214 |
Source: Public Records
Map
Nearby Homes
- 14612 Beach Ave
- 3761 Provincetown Ave
- 14272 Saarinen Ct
- 3981 Cedron St
- 14232 Matisse Ave
- 27 Ohio
- 46 Ohio
- 14072 Picasso Ct
- 17 Rhode Island
- 155 Zephyr Run
- 46 Nebraska
- 280 Tustin Field Dr
- 92 New Season Unit 70
- 10 Goldenbush Unit 36
- 10 Poinsettia
- 5 Poinsettia
- 3 Wintergreen Unit 7
- 1502 Voyager Dr
- 12 Silverwood Unit 19
- 11 Pienza
- 14552 Savin Ave
- 14572 Savin Ave
- 14542 Savin Ave
- 14532 Savin Ave
- 14561 Savin Ave
- 14551 Savin Ave
- 14571 Savin Ave
- 3781 Magnolia St
- 3791 Magnolia St
- 14561 Mango Ave
- 14551 Mango Ave
- 14571 Mango Ave
- 14522 Savin Ave
- 14531 Savin Ave
- 14541 Mango Ave
- 3801 Magnolia St
- 14531 Mango Ave
- 14562 Guama Ave
- 3811 Magnolia St
- 14572 Guama Ave
Your Personal Tour Guide
Ask me questions while you tour the home.