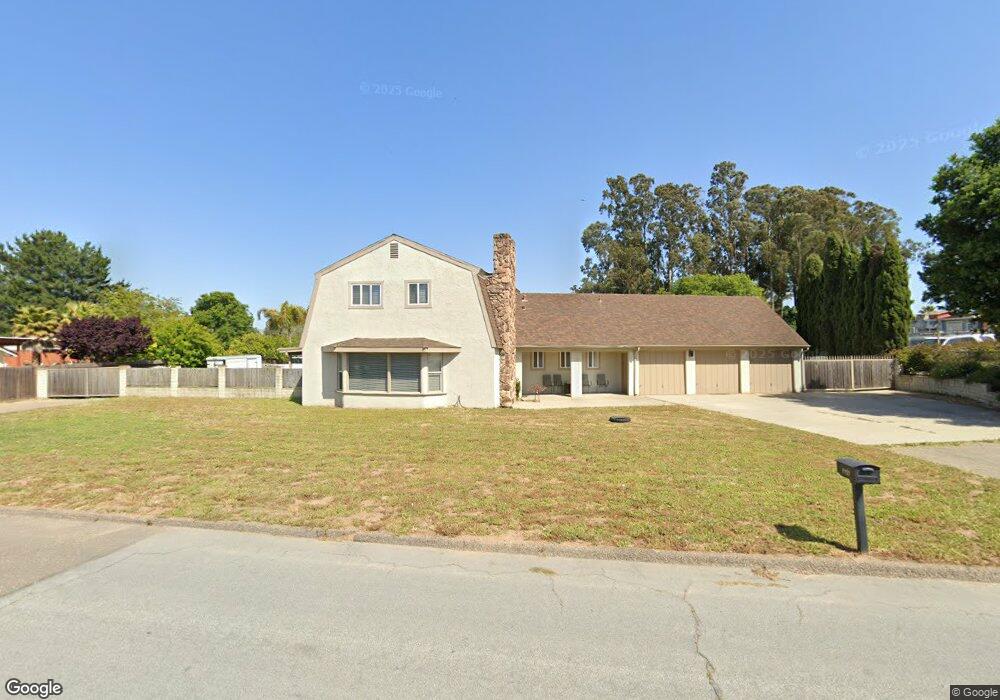
1457 La Quinta Dr Nipomo, CA 93444
Estimated Value: $1,104,000 - $1,240,000
3
Beds
3
Baths
2,354
Sq Ft
$491/Sq Ft
Est. Value
About This Home
This home is located at 1457 La Quinta Dr, Nipomo, CA 93444 and is currently estimated at $1,155,593, approximately $490 per square foot. 1457 La Quinta Dr is a home located in San Luis Obispo County with nearby schools including Dorothea Lange Elementary School, Mesa Middle School, and Nipomo High School.
Ownership History
Date
Name
Owned For
Owner Type
Purchase Details
Closed on
May 3, 2021
Sold by
Evans Joy Marie
Bought by
Evans William Daniel
Current Estimated Value
Home Financials for this Owner
Home Financials are based on the most recent Mortgage that was taken out on this home.
Original Mortgage
$254,000
Outstanding Balance
$229,096
Interest Rate
2.8%
Mortgage Type
New Conventional
Estimated Equity
$926,497
Purchase Details
Closed on
Mar 1, 2018
Sold by
Namba Jerry and Evans William Daniel
Bought by
Evans William Daniel
Purchase Details
Closed on
Nov 24, 1998
Sold by
Evans William and Evans Bill
Bought by
Evans Bill and Evans Joy Marie
Home Financials for this Owner
Home Financials are based on the most recent Mortgage that was taken out on this home.
Original Mortgage
$145,100
Interest Rate
6.84%
Create a Home Valuation Report for This Property
The Home Valuation Report is an in-depth analysis detailing your home's value as well as a comparison with similar homes in the area
Home Values in the Area
Average Home Value in this Area
Purchase History
| Date | Buyer | Sale Price | Title Company |
|---|---|---|---|
| Evans William Daniel | -- | Placer Title Company | |
| Evans William Daniel | -- | None Available | |
| Evans Bill | -- | Chicago Title Co | |
| Evans William | $215,500 | Chicago Title Co |
Source: Public Records
Mortgage History
| Date | Status | Borrower | Loan Amount |
|---|---|---|---|
| Open | Evans William Daniel | $254,000 | |
| Closed | Evans Bill | $145,100 |
Source: Public Records
Tax History Compared to Growth
Tax History
| Year | Tax Paid | Tax Assessment Tax Assessment Total Assessment is a certain percentage of the fair market value that is determined by local assessors to be the total taxable value of land and additions on the property. | Land | Improvement |
|---|---|---|---|---|
| 2025 | $3,395 | $337,194 | $141,082 | $196,112 |
| 2024 | $3,355 | $330,583 | $138,316 | $192,267 |
| 2023 | $3,355 | $324,102 | $135,604 | $188,498 |
| 2022 | $3,302 | $317,748 | $132,946 | $184,802 |
| 2021 | $3,295 | $311,519 | $130,340 | $181,179 |
| 2020 | $3,257 | $308,326 | $129,004 | $179,322 |
| 2019 | $3,235 | $302,281 | $126,475 | $175,806 |
| 2018 | $3,195 | $296,355 | $123,996 | $172,359 |
| 2017 | $3,134 | $290,545 | $121,565 | $168,980 |
| 2016 | $2,954 | $284,849 | $119,182 | $165,667 |
| 2015 | $2,911 | $280,571 | $117,392 | $163,179 |
| 2014 | $2,801 | $275,076 | $115,093 | $159,983 |
Source: Public Records
Map
Nearby Homes
- 1431 La Loma Dr
- 1180 Starlite Dr
- 468 Neptune Dr
- 1655 Kirby Way
- 393 Uranus Ct
- 1127 Starlite Dr
- 261 Hazel Ln
- 426 Polaris Dr
- 457 Polaris Dr
- 1765 Division St
- 945 Jeanette Ln
- 7855 Suey Creek Rd
- 840 Story St
- 585 Via Mira Valle
- 522 Higos Way
- 161 Lot Scenic View Way
- 0 Scenic View Way
- 1685 Scenic View Way
- 615 Sweet Donna Place
- 483 Violet Ave
- 1497 La Quinta Dr
- 1427 La Quinta Dr
- 1458 La Quinta Dr
- 1428 La Quinta Dr
- 1498 La Quinta Dr
- 1527 La Quinta Dr
- 1528 La Quinta Dr
- 1400 La Quinta Dr
- 1558 La Quinta Dr
- 1422 La Loma Dr
- 1446 La Loma Dr
- 1557 La Quinta Dr
- 1460 La Loma Dr
- 1375 La Quinta Dr
- 1380 La Quinta Dr
- 1484 La Loma Dr
- 1457 W Tefft St
- 1457 W Tefft St Unit 6
- 1514 La Loma Dr
- 1497 W Tefft St