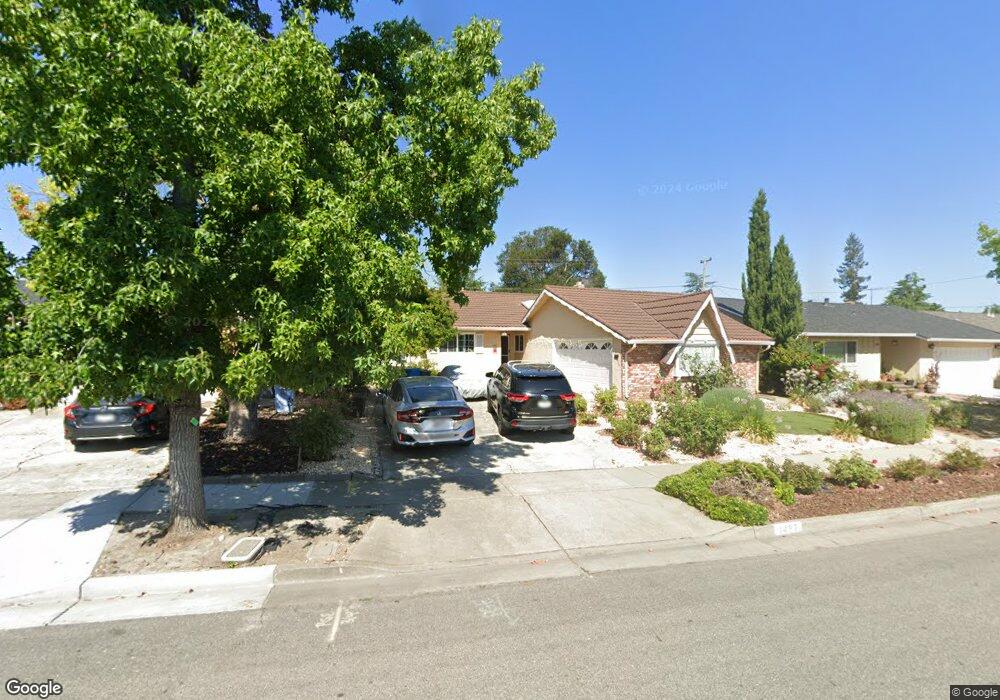
1457 Primrose Way Cupertino, CA 95014
McClellan NeighborhoodEstimated Value: $3,021,567 - $3,263,000
3
Beds
2
Baths
1,551
Sq Ft
$2,036/Sq Ft
Est. Value
About This Home
This home is located at 1457 Primrose Way, Cupertino, CA 95014 and is currently estimated at $3,157,892, approximately $2,036 per square foot. 1457 Primrose Way is a home located in Santa Clara County with nearby schools including Blue Hills Elementary School, John F. Kennedy Middle School, and Monta Vista High School.
Ownership History
Date
Name
Owned For
Owner Type
Purchase Details
Closed on
Aug 26, 1998
Sold by
Pandian Gnanaprakasam
Bought by
Pandian Gnanaprakasam and Pandian Karthikayini Devin
Current Estimated Value
Home Financials for this Owner
Home Financials are based on the most recent Mortgage that was taken out on this home.
Original Mortgage
$130,000
Interest Rate
6.93%
Purchase Details
Closed on
Aug 29, 1997
Sold by
Pandian Gnanaprakasam
Bought by
Pandian Gnanaprakasam and Pandian Karthikayini Devi
Purchase Details
Closed on
Jun 5, 1996
Sold by
Bass Andrea D and Salazar Andrea D
Bought by
Pandian Gnanaprakasam
Home Financials for this Owner
Home Financials are based on the most recent Mortgage that was taken out on this home.
Original Mortgage
$300,000
Outstanding Balance
$19,097
Interest Rate
7.96%
Estimated Equity
$3,138,795
Create a Home Valuation Report for This Property
The Home Valuation Report is an in-depth analysis detailing your home's value as well as a comparison with similar homes in the area
Home Values in the Area
Average Home Value in this Area
Purchase History
| Date | Buyer | Sale Price | Title Company |
|---|---|---|---|
| Pandian Gnanaprakasam | -- | Old Republic Title Company | |
| Pandian Gnanaprakasam | -- | Old Republic Title Company | |
| Pandian Gnanaprakasam | -- | Old Republic Title Company | |
| Pandian Gnanaprakasam | -- | -- | |
| Pandian Gnanaprakasam | $437,000 | Chicago Title Co | |
| Pandian Gnanaprakasam | -- | Chicago Title Co |
Source: Public Records
Mortgage History
| Date | Status | Borrower | Loan Amount |
|---|---|---|---|
| Closed | Pandian Gnanaprakasam | $130,000 | |
| Open | Pandian Gnanaprakasam | $300,000 |
Source: Public Records
Tax History Compared to Growth
Tax History
| Year | Tax Paid | Tax Assessment Tax Assessment Total Assessment is a certain percentage of the fair market value that is determined by local assessors to be the total taxable value of land and additions on the property. | Land | Improvement |
|---|---|---|---|---|
| 2025 | $9,216 | $719,434 | $491,856 | $227,578 |
| 2024 | $9,216 | $705,328 | $482,212 | $223,116 |
| 2023 | $9,116 | $691,499 | $472,757 | $218,742 |
| 2022 | $9,161 | $677,941 | $463,488 | $214,453 |
| 2021 | $9,050 | $664,649 | $454,400 | $210,249 |
| 2020 | $8,930 | $657,835 | $449,741 | $208,094 |
| 2019 | $8,697 | $644,937 | $440,923 | $204,014 |
| 2018 | $8,410 | $632,292 | $432,278 | $200,014 |
| 2017 | $8,335 | $619,895 | $423,802 | $196,093 |
| 2016 | $8,058 | $607,742 | $415,493 | $192,249 |
| 2015 | $7,984 | $598,614 | $409,252 | $189,362 |
| 2014 | $7,774 | $586,889 | $401,236 | $185,653 |
Source: Public Records
Map
Nearby Homes
- 1330 Flower Ct
- 11510 Bianchini Ln
- 7344 Rainbow Dr
- 6944 Chantel Ct
- 00 Cleo Ave
- 6893 Chantel Ct
- 6886 Chantel Ct
- 1270 S Stelling Rd
- 1258 S Stelling Rd
- 7150 Rainbow Dr Unit 42
- 7130 Rainbow Dr Unit 2
- 20717 Meadow Oak Rd
- 20811 Norada Ct
- 7433 Rollingdell Dr
- 18396 Mill Ct
- 7438 Stanford Place
- 12308 Crayside Ln
- 12416 Arroyo de Arguello
- 6757 Devonshire Dr
- 1366 Glenmoor Way
- 1449 Primrose Way
- 1469 Primrose Way
- 1462 Rose Garden Ln
- 1437 Primrose Way
- 1477 Primrose Way
- 1474 Rose Garden Ln
- 1468 Primrose Way
- 1426 Rose Garden Ln
- 1488 Rose Garden Ln
- 1423 Primrose Way
- 1478 Primrose Way
- 1491 Primrose Way
- 1497 Plum Blossom Dr
- 7497 Plum Blossom Dr
- 1412 Rose Garden Ln
- 1496 Rose Garden Ln
- 1451 Poppy Way
- 1492 Primrose Way
- 1407 Primrose Way