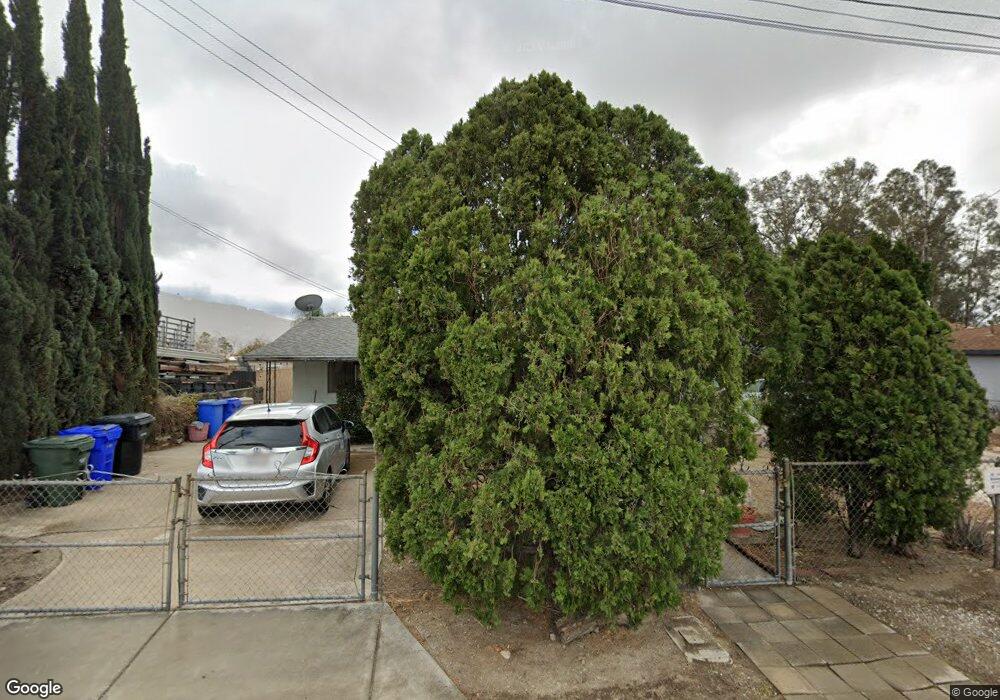
14571 El Molino St Fontana, CA 92335
Estimated Value: $510,205 - $558,000
3
Beds
1
Bath
1,006
Sq Ft
$530/Sq Ft
Est. Value
About This Home
This home is located at 14571 El Molino St, Fontana, CA 92335 and is currently estimated at $533,551, approximately $530 per square foot. 14571 El Molino St is a home located in San Bernardino County with nearby schools including Poplar Elementary School, Sequoia Middle School, and Henry J. Kaiser High School.
Ownership History
Date
Name
Owned For
Owner Type
Purchase Details
Closed on
May 2, 2014
Sold by
Franco Susie
Bought by
Franco Jesse Ordunez and Franco Trinidad R
Current Estimated Value
Purchase Details
Closed on
Jan 23, 2006
Sold by
Franco Jesse R
Bought by
Franco Susie
Home Financials for this Owner
Home Financials are based on the most recent Mortgage that was taken out on this home.
Original Mortgage
$200,000
Outstanding Balance
$112,482
Interest Rate
6.28%
Mortgage Type
Fannie Mae Freddie Mac
Estimated Equity
$421,069
Purchase Details
Closed on
Sep 17, 2004
Sold by
Franco Jesse
Bought by
Franco Jesse R and Franco Susie
Home Financials for this Owner
Home Financials are based on the most recent Mortgage that was taken out on this home.
Original Mortgage
$160,000
Interest Rate
5.8%
Mortgage Type
New Conventional
Create a Home Valuation Report for This Property
The Home Valuation Report is an in-depth analysis detailing your home's value as well as a comparison with similar homes in the area
Home Values in the Area
Average Home Value in this Area
Purchase History
| Date | Buyer | Sale Price | Title Company |
|---|---|---|---|
| Franco Jesse Ordunez | -- | None Available | |
| Franco Susie | -- | Equity Title Company | |
| Franco Jesse R | -- | Ticor Title Company |
Source: Public Records
Mortgage History
| Date | Status | Borrower | Loan Amount |
|---|---|---|---|
| Open | Franco Susie | $200,000 | |
| Previous Owner | Franco Jesse R | $160,000 |
Source: Public Records
Tax History Compared to Growth
Tax History
| Year | Tax Paid | Tax Assessment Tax Assessment Total Assessment is a certain percentage of the fair market value that is determined by local assessors to be the total taxable value of land and additions on the property. | Land | Improvement |
|---|---|---|---|---|
| 2025 | $2,615 | $258,044 | $82,134 | $175,910 |
| 2024 | $2,615 | $252,985 | $80,524 | $172,461 |
| 2023 | $2,547 | $248,024 | $78,945 | $169,079 |
| 2022 | $2,535 | $243,161 | $77,397 | $165,764 |
| 2021 | $2,502 | $238,393 | $75,879 | $162,514 |
| 2020 | $2,495 | $235,949 | $75,101 | $160,848 |
| 2019 | $2,418 | $231,322 | $73,628 | $157,694 |
| 2018 | $2,453 | $226,786 | $72,184 | $154,602 |
| 2017 | $2,438 | $222,340 | $70,769 | $151,571 |
| 2016 | $2,396 | $217,980 | $69,381 | $148,599 |
| 2015 | $2,364 | $214,706 | $68,339 | $146,367 |
| 2014 | $1,973 | $170,000 | $60,000 | $110,000 |
Source: Public Records
Map
Nearby Homes
- 14582 El Molino St
- 17377 20 Valley Blvd
- 10238 Cherry Ave
- 9326 Bunny Ln
- 9828 Carob Ave
- 15162 Cambria St
- 9310 Carob St
- 15240 Carob Ln
- 15278 Boyle Ave
- 14989 Hibiscus Ave
- 9756 Elm Ave
- 15065 Granada Ct
- 10566 Calabash Ave
- 15317 Athol St
- 9059 Beech Ave
- 9963 Eugenia Ave
- 9408 Poplar Ave
- 15082 Valley Blvd
- 14770 Boyle Ave
- 14718 Valencia Ave
- 14561 El Molino St
- 14581 El Molino St
- 14551 El Molino St
- 14590 Rosemary Dr
- 14598 Rosemary Dr
- 14582 Rosemary Dr
- 14572 El Molino St
- 14562 El Molino St
- 14543 El Molino St
- 14570 Rosemary Dr
- 14552 El Molino St
- 14560 Rosemary Dr
- 14620 Mallory Dr
- 14542 El Molino St
- 14550 Rosemary Dr
- 14532 El Molino St
- 14589 Rosemary Dr
- 14597 Rosemary Dr
- 14651 Mallory Dr
- 14581 Rosemary Dr