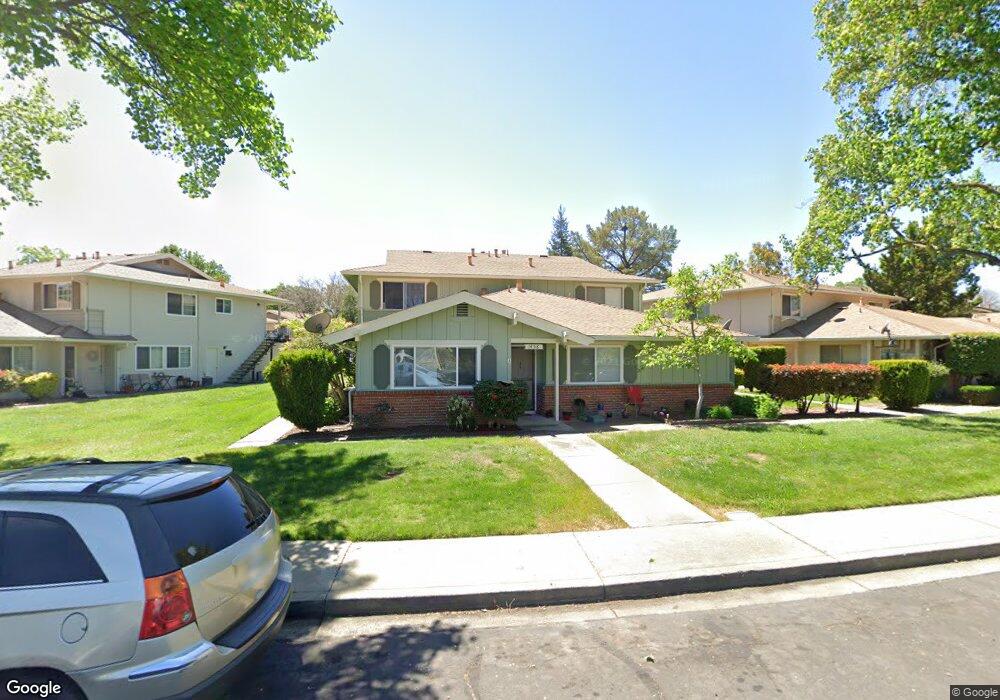
1458 Del Rio Cir Unit B Concord, CA 94518
Tree Haven NeighborhoodEstimated Value: $329,000 - $336,000
2
Beds
1
Bath
873
Sq Ft
$381/Sq Ft
Est. Value
About This Home
This home is located at 1458 Del Rio Cir Unit B, Concord, CA 94518 and is currently estimated at $332,826, approximately $381 per square foot. 1458 Del Rio Cir Unit B is a home located in Contra Costa County with nearby schools including Fair Oaks Elementary School, Oak Grove Middle School, and Ygnacio Valley High School.
Ownership History
Date
Name
Owned For
Owner Type
Purchase Details
Closed on
Jun 1, 2016
Sold by
Callanta Jennifer and Gray Edward
Bought by
The Hormat Malekpour & Manouchehr Pakbaz
Current Estimated Value
Purchase Details
Closed on
May 28, 2016
Sold by
Callanta Jennifer
Bought by
Callanta Jennifer and Gray Edward
Purchase Details
Closed on
Mar 2, 2000
Sold by
Del Rio Investors
Bought by
Thornton Melisande
Home Financials for this Owner
Home Financials are based on the most recent Mortgage that was taken out on this home.
Original Mortgage
$110,344
Interest Rate
8.27%
Mortgage Type
Construction
Create a Home Valuation Report for This Property
The Home Valuation Report is an in-depth analysis detailing your home's value as well as a comparison with similar homes in the area
Home Values in the Area
Average Home Value in this Area
Purchase History
| Date | Buyer | Sale Price | Title Company |
|---|---|---|---|
| The Hormat Malekpour & Manouchehr Pakbaz | $228,000 | Old Republic Title Company | |
| Callanta Jennifer | -- | None Available | |
| Thornton Melisande | $113,000 | Chicago Title Co |
Source: Public Records
Mortgage History
| Date | Status | Borrower | Loan Amount |
|---|---|---|---|
| Previous Owner | Thornton Melisande | $110,344 | |
| Closed | Thornton Melisande | $4,900 |
Source: Public Records
Tax History Compared to Growth
Tax History
| Year | Tax Paid | Tax Assessment Tax Assessment Total Assessment is a certain percentage of the fair market value that is determined by local assessors to be the total taxable value of land and additions on the property. | Land | Improvement |
|---|---|---|---|---|
| 2025 | $3,853 | $269,898 | $165,728 | $104,170 |
| 2024 | $3,764 | $264,607 | $162,479 | $102,128 |
| 2023 | $3,764 | $259,420 | $159,294 | $100,126 |
| 2022 | $3,696 | $254,334 | $156,171 | $98,163 |
| 2021 | $3,592 | $249,348 | $153,109 | $96,239 |
| 2019 | $3,513 | $241,955 | $148,569 | $93,386 |
| 2018 | $3,370 | $237,211 | $145,656 | $91,555 |
| 2017 | $3,247 | $232,560 | $142,800 | $89,760 |
| 2016 | $2,240 | $146,699 | $42,837 | $103,862 |
| 2015 | $2,184 | $144,496 | $42,194 | $102,302 |
| 2014 | $2,118 | $141,667 | $41,368 | $100,299 |
Source: Public Records
Map
Nearby Homes
- 1459 Del Rio Cir Unit C
- 1038 Mohr Ln Unit A
- 1040 Mohr Ln Unit C
- 1356 Del Rio Cir Unit D
- 1369 Del Rio Cir Unit C
- 134 The Trees Dr
- 1064 Mohr Ln Unit C
- 1086 Azalea Ln
- 1781 Gilardy Dr
- 1076 Mohr Ln Unit B
- 1096 Mohr Ln
- 1420 Pear Dr
- 1091 Mohr Ln Unit D
- 1751 Whitman Rd
- 1024 Bermuda Dr
- 1509 Wicket Ct
- 1110 Eureka Ln
- 136 Cleopatra Dr
- 1271 Hookston Rd
- 1950 Emerald St
- 1458 Del Rio Cir
- 1458 Del Rio Cir Unit D
- 1458 Del Rio Cir Unit C
- 1458 Del Rio Cir Unit A
- 1446 Del Rio Cir Unit A
- 1446 Del Rio Cir Unit D
- 1446 Del Rio Cir Unit C
- 1446 Del Rio Cir Unit B
- 1470 Del Rio Cir Unit D
- 1470 Del Rio Cir Unit C
- 1470 Del Rio Cir Unit B
- 1470 Del Rio Cir Unit A
- 1440 Del Rio Cir Unit D
- 1440 Del Rio Cir Unit C
- 1440 Del Rio Cir Unit B
- 1440 Del Rio Cir Unit A
- 1488 Del Rio Cir
- 1488 Del Rio Cir Unit D
- 1488 Del Rio Cir Unit C
- 1488 Del Rio Cir Unit B