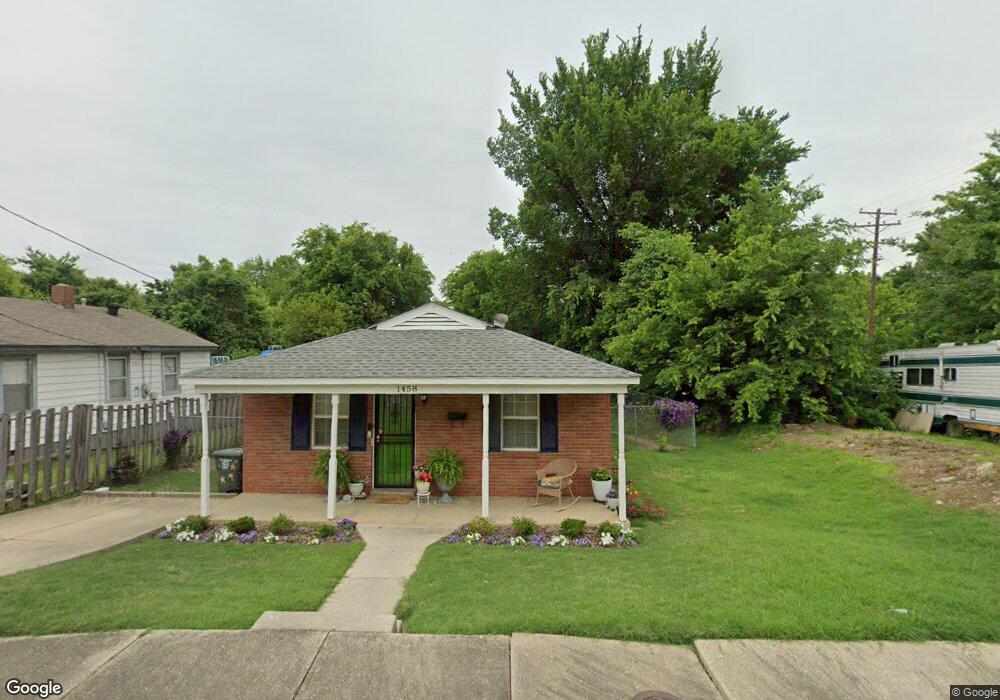
1458 Roberts Rd Memphis, TN 38106
Southeast Memphis NeighborhoodEstimated Value: $50,000 - $78,000
3
Beds
2
Baths
1,000
Sq Ft
$59/Sq Ft
Est. Value
About This Home
This home is located at 1458 Roberts Rd, Memphis, TN 38106 and is currently estimated at $59,062, approximately $59 per square foot. 1458 Roberts Rd is a home located in Shelby County with nearby schools including Hamilton High School, Memphis College Preparatory, and Veritas College Preparatory.
Ownership History
Date
Name
Owned For
Owner Type
Purchase Details
Closed on
Jun 19, 2015
Sold by
Cowan R F
Bought by
Woods Keeya
Current Estimated Value
Purchase Details
Closed on
Jan 17, 2013
Sold by
Cowan J George
Bought by
Cowan R F R and Cowan C
Purchase Details
Closed on
Apr 22, 2008
Sold by
Cowan Verlie
Bought by
Cowan George
Purchase Details
Closed on
Jan 11, 2008
Sold by
Cowan Ronnie
Bought by
Cowan Verlie
Purchase Details
Closed on
Jun 4, 2003
Sold by
Cowan Debra E
Bought by
Cowan Ronnie F
Purchase Details
Closed on
Sep 9, 1999
Sold by
Cowan Ronnie
Bought by
Cowan Debra
Purchase Details
Closed on
Feb 11, 1998
Sold by
Lefkowitz Herbert D and Lefkowitz Lena
Bought by
Cowan Ron
Home Financials for this Owner
Home Financials are based on the most recent Mortgage that was taken out on this home.
Original Mortgage
$22,500
Interest Rate
7.07%
Mortgage Type
Seller Take Back
Create a Home Valuation Report for This Property
The Home Valuation Report is an in-depth analysis detailing your home's value as well as a comparison with similar homes in the area
Home Values in the Area
Average Home Value in this Area
Purchase History
| Date | Buyer | Sale Price | Title Company |
|---|---|---|---|
| Woods Keeya | -- | None Available | |
| Cowan R F R | -- | -- | |
| Cowan George | -- | None Available | |
| Cowan Verlie | -- | None Available | |
| Cowan Ronnie F | -- | -- | |
| Cowan Debra | -- | Memphis Title | |
| Cowan Ron | $25,000 | -- |
Source: Public Records
Mortgage History
| Date | Status | Borrower | Loan Amount |
|---|---|---|---|
| Previous Owner | Cowan Ron | $22,500 |
Source: Public Records
Tax History Compared to Growth
Tax History
| Year | Tax Paid | Tax Assessment Tax Assessment Total Assessment is a certain percentage of the fair market value that is determined by local assessors to be the total taxable value of land and additions on the property. | Land | Improvement |
|---|---|---|---|---|
| 2025 | $186 | $8,400 | $1,450 | $6,950 |
| 2024 | $186 | $5,500 | $725 | $4,775 |
| 2023 | $335 | $5,500 | $725 | $4,775 |
| 2022 | $335 | $5,500 | $725 | $4,775 |
| 2021 | $339 | $5,500 | $725 | $4,775 |
| 2020 | $377 | $5,200 | $725 | $4,475 |
| 2019 | $377 | $5,200 | $725 | $4,475 |
| 2018 | $377 | $5,200 | $725 | $4,475 |
| 2017 | $214 | $5,200 | $725 | $4,475 |
| 2016 | $236 | $5,400 | $0 | $0 |
| 2014 | $236 | $5,400 | $0 | $0 |
Source: Public Records
Map
Nearby Homes
- 1790 Westmore St
- 1439 Menager Rd
- 1431 Ledger Rd
- 1698 Rayner St
- 1448 E Person Ave
- 1824 Rozelle St
- 1832 Rozelle St
- 1649 Pillow St
- 1560 Cane Rd
- 2067 Corry Rd
- 1399 South Ave
- 996 Rozelle St
- 1410 South Ave
- 1372 South Ave
- 1554 Pillow St
- 1524 Gold Ave
- 1408 Eloise Rd
- 1514 S Willett St
- 1385 Eloise Rd
- 1493 Ragan St
- 1452 Roberts Rd
- 1446 Roberts Rd
- 1457 Lyceum Rd
- 1453 Lyceum Rd
- 1831 Cincinnati Rd
- 1447 Lyceum Rd
- 1451 Roberts Rd
- 1449 Lyceum Rd
- 1837 Cincinnati Rd
- 1447 Roberts Rd
- 1822 Cincinnati Rd
- 1824 Cincinnati Rd
- 1436 Roberts Rd
- 1816 Cincinnati Rd
- 1443 Roberts Rd
- 1814 Cincinnati Rd
- 1828 Cincinnati Rd
- 1437 Lyceum Rd
- 1808 Cincinnati Rd
- 1832 Cincinnati Rd