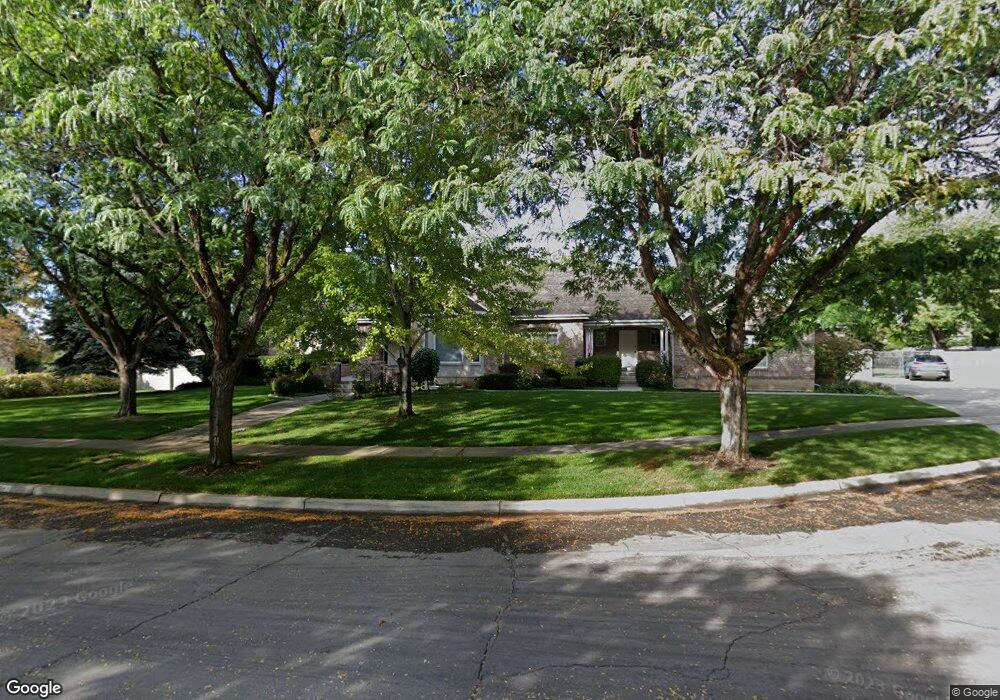
1459 N 430 E Orem, UT 84097
Windsor NeighborhoodEstimated Value: $1,811,006 - $2,085,000
6
Beds
5
Baths
6,834
Sq Ft
$285/Sq Ft
Est. Value
About This Home
This home is located at 1459 N 430 E, Orem, UT 84097 and is currently estimated at $1,948,003, approximately $285 per square foot. 1459 N 430 E is a home located in Utah County with nearby schools including Orchard Elementary School, Canyon View Junior High School, and Timpanogos High School.
Ownership History
Date
Name
Owned For
Owner Type
Purchase Details
Closed on
Apr 15, 2013
Sold by
Seow Joel L
Bought by
Seow Anthony S and Seow Juel L
Current Estimated Value
Purchase Details
Closed on
Feb 3, 2003
Sold by
Downey Sla
Bought by
Seow Anthony S
Purchase Details
Closed on
Sep 18, 2002
Sold by
Neeley Mary Sue
Bought by
Downey Svgs & Loan Assn Fa
Purchase Details
Closed on
May 20, 1999
Sold by
Neely Ozy Jay
Bought by
Neeley Mary Sue
Purchase Details
Closed on
Apr 15, 1997
Sold by
Carpenter Merlin P and Carpenter Sofia A
Bought by
Neeley Ozy Jay
Home Financials for this Owner
Home Financials are based on the most recent Mortgage that was taken out on this home.
Original Mortgage
$419,300
Interest Rate
7.86%
Create a Home Valuation Report for This Property
The Home Valuation Report is an in-depth analysis detailing your home's value as well as a comparison with similar homes in the area
Home Values in the Area
Average Home Value in this Area
Purchase History
| Date | Buyer | Sale Price | Title Company |
|---|---|---|---|
| Seow Anthony S | -- | None Available | |
| Seow Anthony S | -- | Equity Title Agency Inc | |
| Downey Svgs & Loan Assn Fa | $427,673 | Backman Stewart Title Servi | |
| Neeley Mary Sue | -- | First American Title Ins Co | |
| Neeley Ozy Jay | -- | -- |
Source: Public Records
Mortgage History
| Date | Status | Borrower | Loan Amount |
|---|---|---|---|
| Previous Owner | Neeley Ozy Jay | $419,300 |
Source: Public Records
Tax History
| Year | Tax Paid | Tax Assessment Tax Assessment Total Assessment is a certain percentage of the fair market value that is determined by local assessors to be the total taxable value of land and additions on the property. | Land | Improvement |
|---|---|---|---|---|
| 2025 | $6,294 | $886,820 | -- | -- |
| 2024 | $6,294 | $769,615 | $0 | $0 |
| 2023 | $5,584 | $733,920 | $0 | $0 |
| 2022 | $5,431 | $691,515 | $0 | $0 |
| 2021 | $5,472 | $1,055,200 | $518,300 | $536,900 |
| 2020 | $5,084 | $963,500 | $431,900 | $531,600 |
| 2019 | $4,683 | $922,900 | $431,900 | $491,000 |
| 2018 | $4,901 | $922,900 | $431,900 | $491,000 |
| 2017 | $4,970 | $501,325 | $0 | $0 |
| 2016 | $5,019 | $466,895 | $0 | $0 |
| 2015 | $3,824 | $336,380 | $0 | $0 |
| 2014 | $3,504 | $306,845 | $0 | $0 |
Source: Public Records
Map
Nearby Homes
- 363 E 1395 N Unit 22
- 1371 N 330 E Unit 8
- 193 E 1570 N
- 1636 N 160 E
- 1638 N 160 E
- 540 E Quail Rd
- 372 E 1165 N
- 713 E 1450 N Unit 23
- 713 E 1500 St N Unit 19
- 733 E 1450 N Unit 5
- 710 E 1280 N
- 747 E 1500 N Unit 13
- 1643 N Mountain Oaks Dr
- 1366 N 750 E
- 1356 N 750 E Unit 11
- 1324 N 750 E Unit 3
- 695 E 1870 N
- 976 N 560 E
- 49 W 1880 N
- 917 N Garden Dr
Your Personal Tour Guide
Ask me questions while you tour the home.