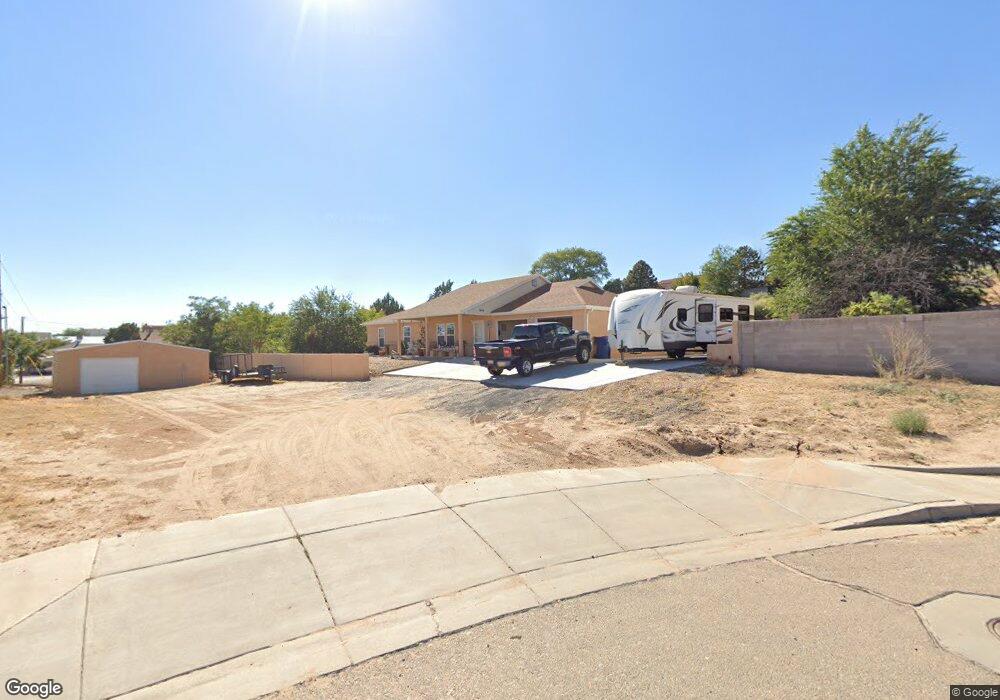
1459 Pecos Rd SW Los Lunas, NM 87031
Estimated Value: $302,000 - $387,000
3
Beds
2
Baths
1,802
Sq Ft
$197/Sq Ft
Est. Value
About This Home
This home is located at 1459 Pecos Rd SW, Los Lunas, NM 87031 and is currently estimated at $355,295, approximately $197 per square foot. 1459 Pecos Rd SW is a home located in Valencia County with nearby schools including Raymond Gabaldon Elementary School, Los Lunas Middle School, and Los Lunas High School.
Ownership History
Date
Name
Owned For
Owner Type
Purchase Details
Closed on
Mar 11, 2021
Sold by
Apodaca Armando P
Bought by
Apodaca Armando P and Pacheco Michelle R
Current Estimated Value
Purchase Details
Closed on
Sep 1, 2017
Sold by
Apodaca Armando P and Pacheco Michelle R
Bought by
Apodaca Armando P
Home Financials for this Owner
Home Financials are based on the most recent Mortgage that was taken out on this home.
Original Mortgage
$169,865
Outstanding Balance
$132,249
Interest Rate
3.92%
Mortgage Type
VA
Estimated Equity
$223,046
Purchase Details
Closed on
Oct 29, 2009
Sold by
Ives Curtis and Lafay Ives Theresa M
Bought by
Apodaca Amando P
Home Financials for this Owner
Home Financials are based on the most recent Mortgage that was taken out on this home.
Original Mortgage
$189,999
Interest Rate
4.9%
Mortgage Type
VA
Purchase Details
Closed on
Nov 16, 2005
Sold by
Roberts George and Roberts Maria
Bought by
Ives Curtis and Lafay Ives Theresa M
Create a Home Valuation Report for This Property
The Home Valuation Report is an in-depth analysis detailing your home's value as well as a comparison with similar homes in the area
Home Values in the Area
Average Home Value in this Area
Purchase History
| Date | Buyer | Sale Price | Title Company |
|---|---|---|---|
| Apodaca Armando P | -- | None Available | |
| Apodaca Armando P | -- | First American Title | |
| Apodaca Amando P | -- | Stewart Title | |
| Ives Curtis | -- | Stewart Title |
Source: Public Records
Mortgage History
| Date | Status | Borrower | Loan Amount |
|---|---|---|---|
| Open | Apodaca Armando P | $169,865 | |
| Closed | Apodaca Amando P | $189,999 |
Source: Public Records
Tax History Compared to Growth
Tax History
| Year | Tax Paid | Tax Assessment Tax Assessment Total Assessment is a certain percentage of the fair market value that is determined by local assessors to be the total taxable value of land and additions on the property. | Land | Improvement |
|---|---|---|---|---|
| 2024 | $2,507 | $81,666 | $18,333 | $63,333 |
| 2023 | $2,491 | $81,666 | $18,333 | $63,333 |
| 2022 | $2,506 | $81,156 | $18,333 | $62,823 |
| 2021 | $2,450 | $78,792 | $18,758 | $60,034 |
| 2020 | $2,418 | $76,497 | $18,212 | $58,285 |
| 2019 | $2,432 | $76,497 | $18,212 | $58,285 |
| 2018 | $2,389 | $76,497 | $18,212 | $58,285 |
| 2017 | $2,338 | $76,047 | $18,212 | $57,835 |
| 2016 | $2,267 | $73,832 | $18,212 | $55,620 |
| 2015 | -- | $71,682 | $18,212 | $53,470 |
| 2013 | -- | $67,567 | $18,212 | $49,355 |
| 2011 | -- | $196,797 | $53,046 | $143,751 |
Source: Public Records
Map
Nearby Homes
- 1628 Drake Rd
- 0 Drake Rd
- 981 Canal Blvd SW
- 1107 Valley View Dr SW
- 0 Main Grant
- 1330 Crestview Dr SW
- 1864 Villa Contesa Loop NW
- 1407 Valley View Dr SW
- 1034 Wagon Trail St
- 1050 Wagon Trail St SW
- 2258 Calle de Ortiz SW
- 2260 Calle de Alifas SW
- 1551 Valley View Dr SW
- 600 Don Federico Ct SW
- 823 Corral St SW
- 1902 Valley View Dr SW
- 00 New Mexico 6
- 2248 Calle de Silverio
- 251 Sichler Rd SW Unit B
- 2260 Firewheel Ave SW
- 1520 Coplen Dr SW
- 1443 Pecos Rd SW
- 1443 Pecos Rd SW
- 651 Capitol Dr SW
- 1444 Coplen Dr SW
- 644 Capitol Dr SW
- 644 Capital Dr SW
- 1612 Coplen Dr SW
- 1420 Coplen Dr SW
- 1511 Coplen Dr SW
- 1443 Coplen Dr
- 1527 Coplen Dr SW
- 660 Capitol Dr SW
- 0 Capital St Unit 658327
- 720 Grant Blvd SW
- 636 Grant Blvd SW
- 675 Breech Dr SW
- 675 Breech Dr SW
- 0 Coplen Dr
- 661 Breech Dr SW