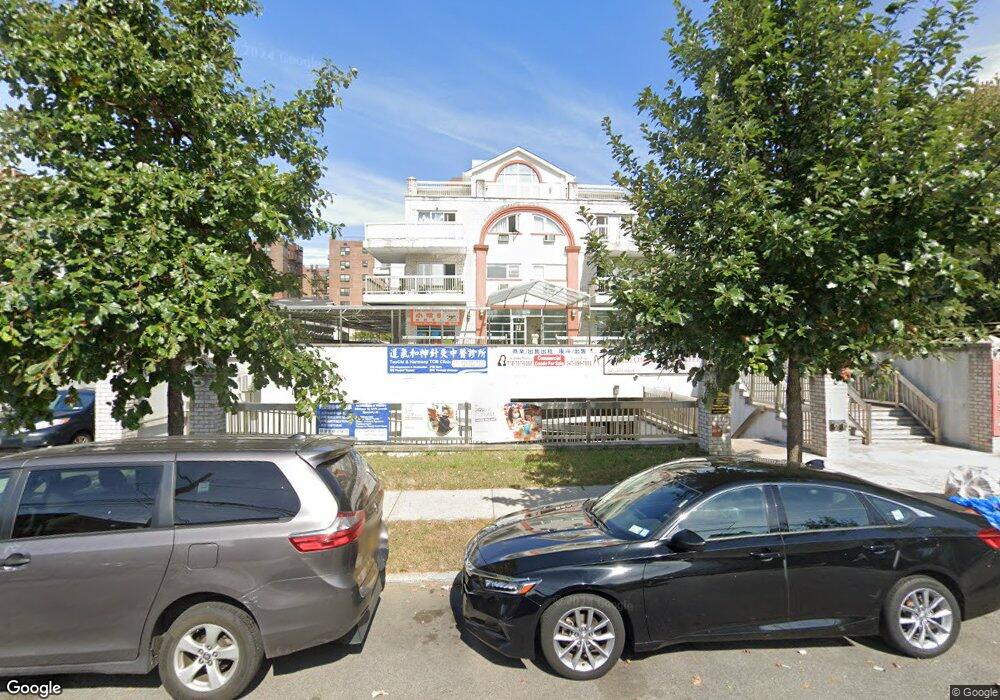
146-27 Beech Ave Unit 4A Flushing, NY 11355
Flushing NeighborhoodEstimated Value: $814,000 - $845,000
2
Beds
2
Baths
1,148
Sq Ft
$720/Sq Ft
Est. Value
About This Home
This home is located at 146-27 Beech Ave Unit 4A, Flushing, NY 11355 and is currently estimated at $826,574, approximately $720 per square foot. 146-27 Beech Ave Unit 4A is a home located in Queens County with nearby schools including P.S. 22 - Thomas Jefferson, J.H.S. 189Q Daniel Carter Beard, and Flushing High School.
Create a Home Valuation Report for This Property
The Home Valuation Report is an in-depth analysis detailing your home's value as well as a comparison with similar homes in the area
Home Values in the Area
Average Home Value in this Area
Tax History Compared to Growth
Tax History
| Year | Tax Paid | Tax Assessment Tax Assessment Total Assessment is a certain percentage of the fair market value that is determined by local assessors to be the total taxable value of land and additions on the property. | Land | Improvement |
|---|---|---|---|---|
| 2025 | $7,890 | $80,310 | $20,790 | $59,520 |
| 2024 | $7,890 | $78,419 | $20,790 | $57,629 |
| 2023 | $5,846 | $78,189 | $20,790 | $57,399 |
| 2022 | $3,924 | $78,062 | $20,790 | $57,272 |
| 2021 | $2,060 | $76,502 | $20,790 | $55,712 |
| 2020 | $233 | $76,180 | $20,790 | $55,390 |
| 2019 | $235 | $77,511 | $20,790 | $56,721 |
| 2018 | $237 | $69,768 | $20,790 | $48,978 |
| 2017 | $237 | $66,697 | $20,790 | $45,907 |
| 2016 | $241 | $66,697 | $20,790 | $45,907 |
| 2015 | $188 | $56,325 | $20,790 | $35,535 |
| 2014 | $188 | $53,935 | $20,790 | $33,145 |
Source: Public Records
Map
Nearby Homes
- 144-64 Sanford Ave Unit 11
- 4223 Parsons Blvd Unit 1E
- 4223 Parsons Blvd Unit 5D
- 42-11 Parsons Blvd Unit Parking
- 42-11 Parsons Blvd Unit 4D
- 42-11 Parsons Blvd Unit 4B
- 42-11 Parsons Blvd Unit 2D
- 42-05 Parsons Blvd Unit 4A
- 42-26 147th St Unit 5B
- 14430 Sanford Ave Unit 4T
- 4218 147th St Unit 2E
- 4218 147th St Unit 3J
- 42-18 147th St Unit 4A
- 144-54 Sanford Ave Unit 38
- 144-44 Sanford Ave Unit 3
- 144-44 Sanford Ave Unit 3H
- 143-37 Beech Ave
- 144-30 Sanford Ave Unit 2C
- 144-30 Sanford Ave Unit 4N
- 144-30 Sanford Ave Unit 5
- 146-27 Beech Ave Unit 3A
- 146-27 Beech Ave Unit 3C
- 146-27 Beech Ave Unit 2A
- 146-27 Beech Ave
- 146-27 Beech Ave Unit 4B
- 146-27 Beech Ave Unit 1B
- 146-27 Beech Ave Unit 4C
- 146-11 Beech Ave Unit 2C
- 146-11 Beech Ave Unit 1B
- 146-11 Beech Ave Unit 2B
- 146-11 Beech Ave Unit 2D
- 14651 Beech Ave
- 14609 Beech Ave
- 14619 Beech Ave
- 14611 Beech Ave Unit 2A1B
- 14611 Beech Ave Unit 2D
- 14611 Beech Ave Unit 2C
- 14611 Beech Ave Unit 2B
- 14611 Beech Ave Unit 2A
- 14611 Beech Ave Unit 1D