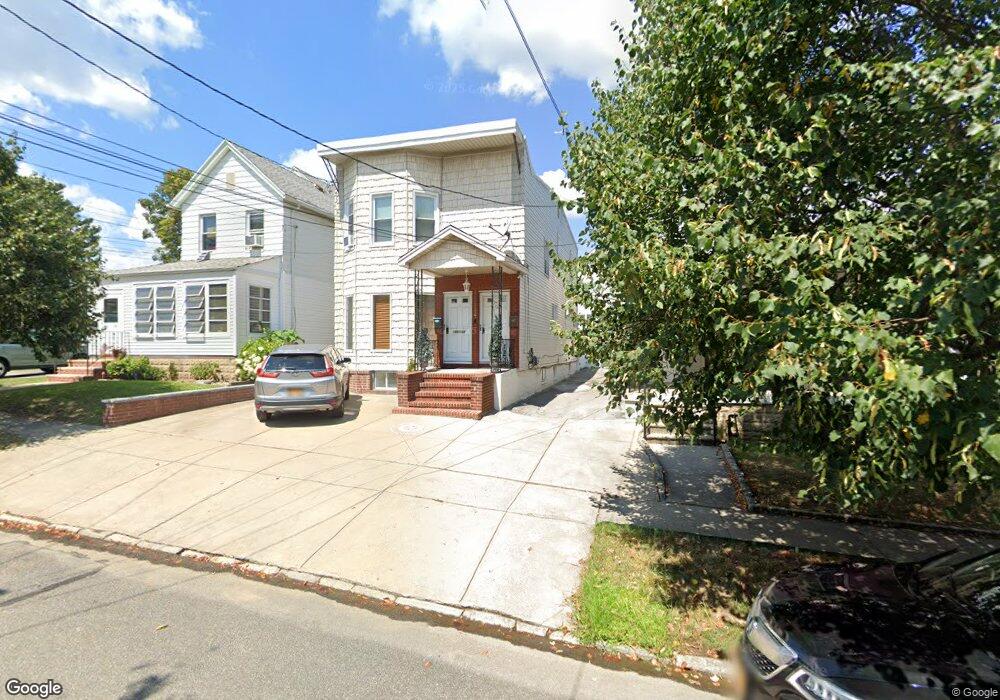
146-33 15th Ave Unit 2 Flushing, NY 11357
Whitestone NeighborhoodEstimated Value: $1,125,000 - $1,305,000
3
Beds
1
Bath
1,854
Sq Ft
$647/Sq Ft
Est. Value
About This Home
This home is located at 146-33 15th Ave Unit 2, Flushing, NY 11357 and is currently estimated at $1,199,010, approximately $646 per square foot. 146-33 15th Ave Unit 2 is a home located in Queens County with nearby schools including P.S. 79 - Francis Lewis, Jhs 185 Edward Bleeker, and Flushing High School.
Ownership History
Date
Name
Owned For
Owner Type
Purchase Details
Closed on
Sep 27, 2007
Sold by
Sales Adys
Bought by
Bourdier Nicolas and Rodriguez Bernarda S
Current Estimated Value
Home Financials for this Owner
Home Financials are based on the most recent Mortgage that was taken out on this home.
Original Mortgage
$118,700
Outstanding Balance
$74,844
Interest Rate
6.49%
Estimated Equity
$1,124,166
Purchase Details
Closed on
May 10, 2006
Sold by
Henken Joyce
Bought by
Sales Adys
Home Financials for this Owner
Home Financials are based on the most recent Mortgage that was taken out on this home.
Original Mortgage
$529,600
Interest Rate
6.55%
Mortgage Type
Purchase Money Mortgage
Create a Home Valuation Report for This Property
The Home Valuation Report is an in-depth analysis detailing your home's value as well as a comparison with similar homes in the area
Home Values in the Area
Average Home Value in this Area
Purchase History
| Date | Buyer | Sale Price | Title Company |
|---|---|---|---|
| Bourdier Nicolas | $725,000 | -- | |
| Bourdier Nicolas | $725,000 | -- | |
| Sales Adys | $662,000 | -- | |
| Sales Adys | $662,000 | -- |
Source: Public Records
Mortgage History
| Date | Status | Borrower | Loan Amount |
|---|---|---|---|
| Open | Bourdier Nicolas | $118,700 | |
| Closed | Bourdier Nicolas | $118,700 | |
| Open | Bourdier Nicolas | $533,800 | |
| Closed | Bourdier Nicolas | $533,800 | |
| Previous Owner | Sales Adys | $529,600 |
Source: Public Records
Tax History
| Year | Tax Paid | Tax Assessment Tax Assessment Total Assessment is a certain percentage of the fair market value that is determined by local assessors to be the total taxable value of land and additions on the property. | Land | Improvement |
|---|---|---|---|---|
| 2025 | $7,168 | $36,617 | $8,217 | $28,400 |
| 2024 | $7,168 | $35,686 | $8,500 | $27,186 |
| 2023 | $6,822 | $33,966 | $8,898 | $25,068 |
| 2022 | $6,437 | $57,180 | $15,120 | $42,060 |
| 2021 | $6,424 | $56,640 | $15,120 | $41,520 |
| 2020 | $6,459 | $61,620 | $15,120 | $46,500 |
| 2019 | $6,221 | $65,100 | $15,120 | $49,980 |
| 2018 | $5,770 | $28,305 | $7,516 | $20,789 |
| 2017 | $5,478 | $26,872 | $7,549 | $19,323 |
| 2016 | $5,085 | $26,872 | $7,549 | $19,323 |
| 2015 | $3,058 | $25,428 | $8,833 | $16,595 |
| 2014 | $3,058 | $24,782 | $10,056 | $14,726 |
Source: Public Records
Map
Nearby Homes
- 14633 15th Ave
- 146-37 15th Ave
- 14631 15th Ave
- 14635 15th Ave
- 14637 15th Ave
- 1419 146th Place
- 1419 146th Place Unit ST
- 1419 146th Place
- 14645 15th Ave
- 1417 146th Place
- 14621 15th Ave
- 14621 15th Ave
- 223 146th Place
- 14-20 15 Ave
- 1420 147th St
- 14636 15th Ave
- 1413 146th Place
- 14634 15th Ave
- 14638 15th Ave
- 1420 146th Place
Your Personal Tour Guide
Ask me questions while you tour the home.