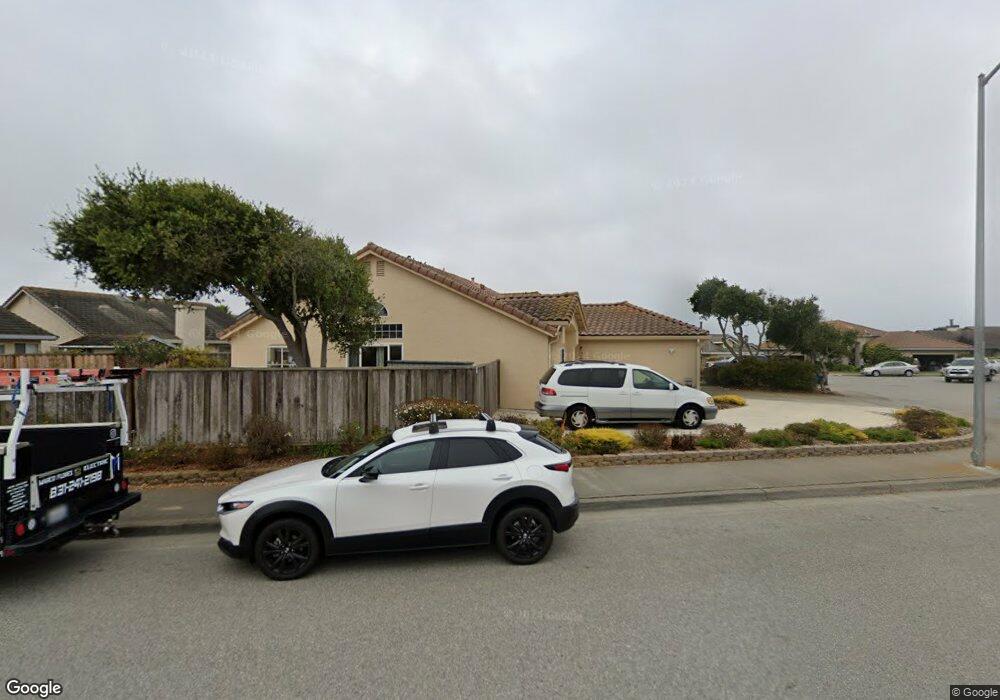
146 Aaron Way Marina, CA 93933
Estimated Value: $926,000 - $998,000
3
Beds
2
Baths
1,629
Sq Ft
$584/Sq Ft
Est. Value
About This Home
This home is located at 146 Aaron Way, Marina, CA 93933 and is currently estimated at $950,915, approximately $583 per square foot. 146 Aaron Way is a home located in Monterey County with nearby schools including Ione Olson Elementary School, Los Arboles Middle School, and Marina High School.
Ownership History
Date
Name
Owned For
Owner Type
Purchase Details
Closed on
Jul 21, 2005
Sold by
Reddy Kupsami and Reddy Indra B
Bought by
Reddy Kupsami and Reddy Indra B
Current Estimated Value
Purchase Details
Closed on
Mar 27, 1998
Sold by
Olson Mark and Olson Medea
Bought by
Reddy Kupsami and Reddy Indra B
Home Financials for this Owner
Home Financials are based on the most recent Mortgage that was taken out on this home.
Original Mortgage
$203,000
Outstanding Balance
$38,434
Interest Rate
7.07%
Estimated Equity
$912,481
Purchase Details
Closed on
Jul 12, 1994
Sold by
Monterey Bay Marina L P
Bought by
Olson Mark and Olson Medea
Home Financials for this Owner
Home Financials are based on the most recent Mortgage that was taken out on this home.
Original Mortgage
$172,500
Interest Rate
5.62%
Create a Home Valuation Report for This Property
The Home Valuation Report is an in-depth analysis detailing your home's value as well as a comparison with similar homes in the area
Home Values in the Area
Average Home Value in this Area
Purchase History
| Date | Buyer | Sale Price | Title Company |
|---|---|---|---|
| Reddy Kupsami | -- | -- | |
| Reddy Kupsami | $268,000 | Stewart Title | |
| Olson Mark | $224,000 | First American Title Co |
Source: Public Records
Mortgage History
| Date | Status | Borrower | Loan Amount |
|---|---|---|---|
| Open | Reddy Kupsami | $203,000 | |
| Previous Owner | Olson Mark | $172,500 |
Source: Public Records
Tax History Compared to Growth
Tax History
| Year | Tax Paid | Tax Assessment Tax Assessment Total Assessment is a certain percentage of the fair market value that is determined by local assessors to be the total taxable value of land and additions on the property. | Land | Improvement |
|---|---|---|---|---|
| 2025 | $4,553 | $427,897 | $175,627 | $252,270 |
| 2024 | $4,553 | $419,508 | $172,184 | $247,324 |
| 2023 | $4,510 | $411,283 | $168,808 | $242,475 |
| 2022 | $4,444 | $403,220 | $165,499 | $237,721 |
| 2021 | $4,374 | $395,314 | $162,254 | $233,060 |
| 2020 | $4,231 | $391,262 | $160,591 | $230,671 |
| 2019 | $4,421 | $383,592 | $157,443 | $226,149 |
| 2018 | $4,257 | $376,071 | $154,356 | $221,715 |
| 2017 | $3,940 | $368,698 | $151,330 | $217,368 |
| 2016 | $3,873 | $361,469 | $148,363 | $213,106 |
| 2015 | $3,814 | $356,040 | $146,135 | $209,905 |
| 2014 | $3,782 | $349,067 | $143,273 | $205,794 |
Source: Public Records
Map
Nearby Homes
- 162 Linde Cir
- 2746 Sand Dunes Ave
- 246 Cosky Dr
- 000 Beach Rd
- 126 Cypress Lakes Ct
- 3248 Fitzgerald Cir
- 3137 Seacrest Ave Unit 17
- 221 Mortimers (Unit B) Ln
- 220 Mortimer Ln
- 3095 Marina Dr Unit 2
- 3095 Marina Dr Unit 30
- 3095 Marina Dr Unit 35
- 356 Reservation Rd Unit 50
- 356 Reservation Rd Unit 90
- 356 Reservation Rd Unit 68
- 189 San Pablo Ct Unit 13
- 310 Carmel Ave
- 3141 Ocean Terrace
- 347 Carmel Ave Unit 71
- 347 Carmel Ave Unit 2